


The divide between male and female students is a long and contentious aspect of the history of the University of Oxford and the University of Cambridge. Though women have only been allowed into these prestigious universities for a fraction of their total lifetimes, the progress towards equality made in the last 100 years has allowed each institution to become a place of opportunity for students, regardless of gender.
While this may be the case in a general sense, some wonder if a gender divide still exists in certain areas of Oxbridge. Reports have already been published detailing the potential challenges certain genders face during their time studying at Oxbridge, so could these issues also be present in the admissions process? In this guide, we’re going to look at the data published by the two universities to understand exactly how equal each university is and how far the admissions process has progressed over the years.
Here are the key topics covered in this guide:
- The history of women at Oxbridge is an important one to remember and provide context to the current state of admissions and Oxford and Cambridge.
- Admissions statistics from recent years indicates that men and women have a near equal chance of acceptance to either university.
- However, there are still major divides in gender seen across many courses and subjects taught at Oxbridge. In some cases women have a noticeably reduced chance of success.
- The gender divide at Oxford and Cambridge's Colleges are far less significant, though there are still cases of imbalance in admissions.
The History of The Oxbridge Gender Gap
Before we look at the current day statistics from Oxbridge, it’s important to understand how this issue started and how far the universities have come since then.
As you may already know, the two universities are hundreds of years old, with Oxford first being established in 1096 and Cambridge in 1209. For centuries, the status quo was reduced rights for women, including their exclusion from higher education. With the rise in demand for equal rights starting in the 1800s, universities were naturally brought into this conversation as calls to admit female students increased.
The history of women at Oxbridge is too detailed to explore at length here, though Oxford and Cambridge each have comprehensive resources exploring this aspect of their legacy. However, here is a timeline of some of the key events that led to the current day.
The first nine women are granted access to university education in the UK at the University of London.
Girton College is established at the University of Cambridge as the first women’s college. Students of this college are not yet able to earn degrees as men are able to.
The University of London becomes the first university in the UK to allow female students to earn degrees, putting them on equal terms with male students.
Oxford opens Lady Margaret Hall and Somerville Hall, admitting its first female students. They were, again, not able to obtain degrees at this time.
Oxford provides its first degrees to female students, with multiple students graduating in October of this year.
Somerville, St Hugh’s, St Hilda’s and Lady Margaret Hall all receive royal charters at Oxford.
Cambridge allows women to earn degrees for the first time.
Quotas for female students – which were set in 1927 to restrict the number of women at the university – are abolished at Oxford.
Churchill, King’s and Clare become the first co-ed colleges at Cambridge.
Hughes Hall, Cambridge, admits male students for the first time.
As you can see, it has taken a lot of milestones to reach the current state of admissions at Oxbridge. However, it’s also helpful to understand how the admissions statistics themselves evolved over the years, so let’s review the data next.
Less than 16% of Oxbridge applicants got their place, but 59% of UniAdmissions students got their Oxbridge offer.
No matter who you are, the chances of getting an offer are extremely low. However, with support from UniAdmissions, you can triple those chances while becoming an ideal applicant and student. Our Full-Blue Programmes provide world-class application support from start to finish, including expert resources, unlimited one-to-one tuition sessions, intensive courses and much more.
Discover our Full-Blue Programme by clicking the button below to learn how you can enrol and triple your chances of success.
Historic Oxbridge Admissions for Males and Females
Naturally, data from the early to mid-1900s isn’t easy to access, so we don’t have a full snapshot of how many students were admitted each year. However, we do have helpful data from both universities that covers much of the latter half of the century. This data provides a clear look at how much progress was made in providing equal opportunities for all students.
Cambridge Admissions Data (1969 - 1999)
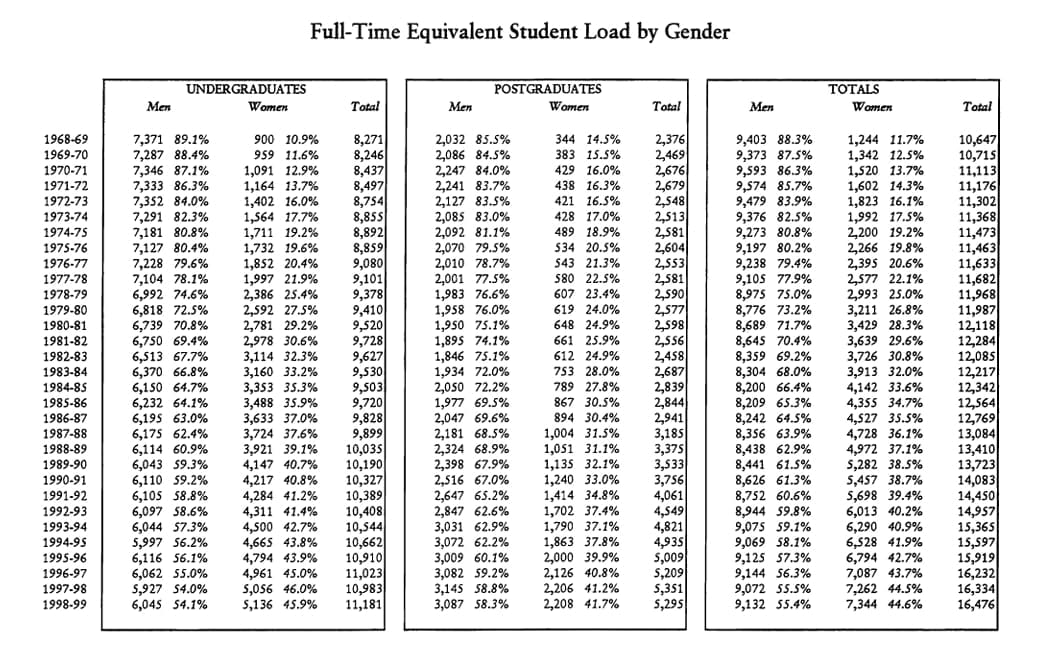
As we can see from this data, the earliest admissions cycle featured in this data set was 1968 – 69, where only 10.9% of undergraduate students were female, and only 11.9% of students overall were female. Every single year following this saw an increase in the percentage of female students, ending in 1998/99, where 44.6% of all newly admitted students were female.
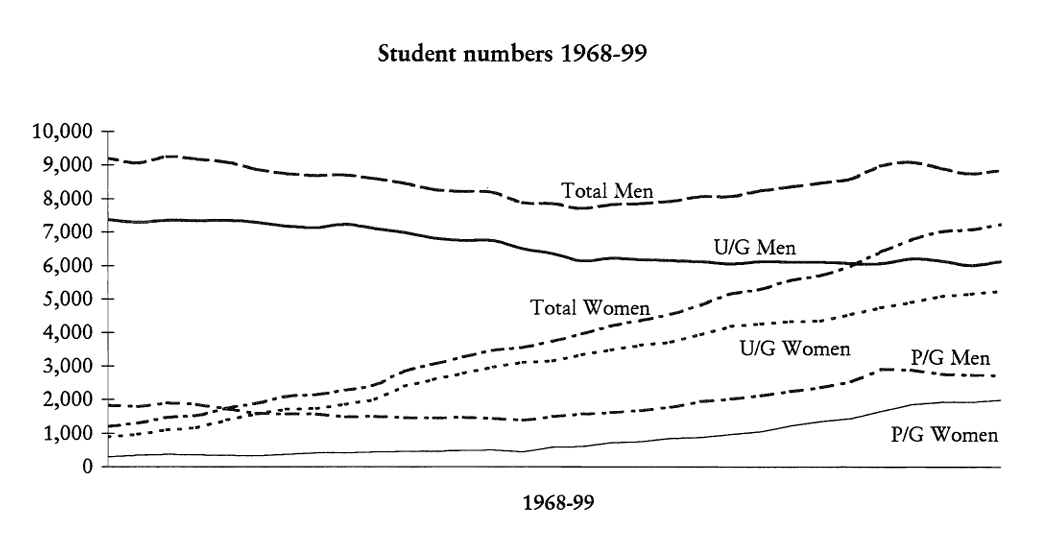
This graph visualises this increase very clearly while also demonstrating that the increase in female students didn’t lead to a proportional decrease in male students. From 1969 to 1999, the university saw nearly 6,000 more female students admitted, rising from 1,244 to 7,344.
Meanwhile, the total number of male students decreased by roughly 300 over this period, although the male postgraduate student population actually increased by 1,000 (comparing 1968/69 to 1998/99). Throughout this period, the total student population grew by nearly 6,000, which is proportional to the increase in female students.
Oxford Admissions Data (1938 - 2019)
We don’t have as insightful information as provided by Cambridge, but we do have this chart that details the percentage of female students admitted to the university.
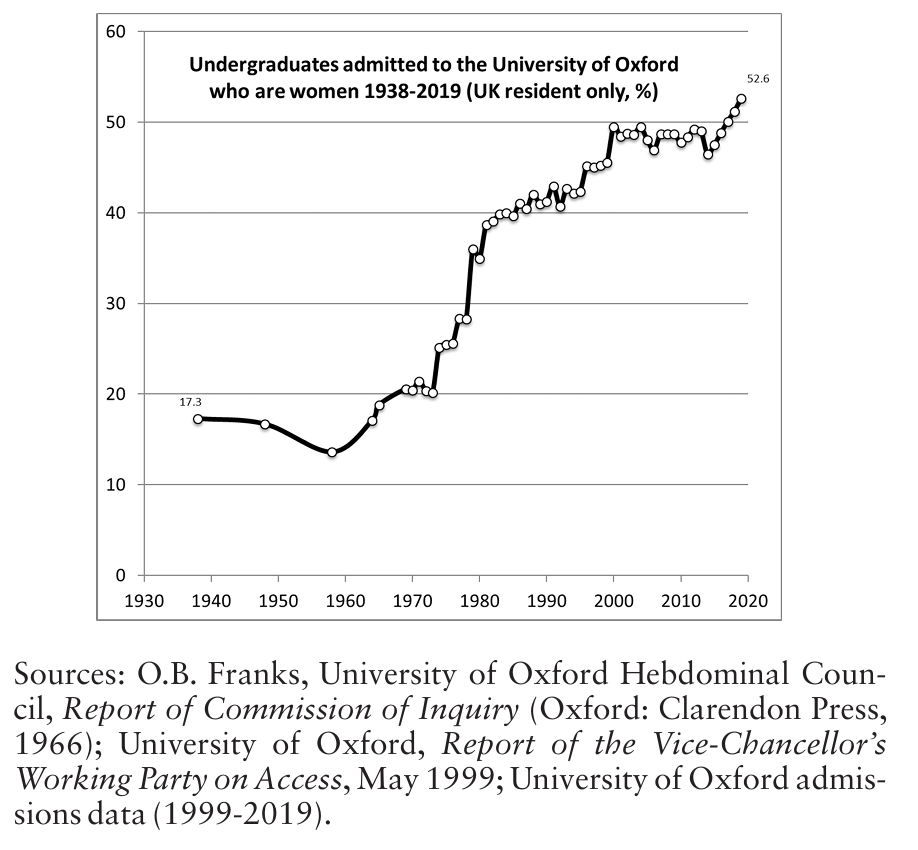
The increase visible in this chart is far sharper than what we see in Cambridge’s data, although this is likely due to the difference in how the data is being measured (percentage versus total student count). The earliest record shows that female students made up just 17.3% of the cohort in 1938, less than 20 years after the first female students were admitted.
We can see the largest increase between 1975 and 1980, where the percentage of female students rose from roughly 20% to over 35%. Since 2000, this percentage has remained around 2% to 5% lower than male student representation until 2019, when female students made up 52.6% of newly admitted undergraduates.
While this data demonstrates that representation of female students was increasing at both universities, this isn’t the full story, as we also have to consider the number of female applicants to the universities. This data isn’t currently available for most years prior to 2000, so it’s time to review more modern data.

Access "The Big Book Of Oxbridge Applications" For FREE
If you want to learn more about applying to and studying at Oxford and Cambridge, get The Big Book Of Oxbridge Applications, available for free right here! Through over 350 pages, you will find:
- 28 example Oxbridge Personal Statements
- Over 40 admissions test practice questions
- Interviews with Oxbridge students and graduates
- Additional downloadable resources
Fill in your details below to claim your digital copy today!

Oxbridge Admissions Data (2007 - 2023)
While we don’t have comprehensive data for Oxbridge admissions in the 20th century, we do have information about the recent state of admissions at each university.
For both Oxford and Cambridge, we can see the number of applicants, offers and acceptances split by gender (bear in mind that both universities and UCAS record gender data as a binary metric). From these, we can understand the chances of getting an offer and the chances of being accepted among both cohorts.
In this case, we have calculated the offer and acceptance rate based on the applications of a single gender (e.g. male offer rate = number of male offers/number of male applicants). This provides a better understanding of the proportions of male and female students based on the number of applicants for each gender.
Let’s start off by reviewing the data for Oxford, which is dated from 2007 to 2023, the most recently available data set available (years reference the year of entry):
Oxford Admissions Data (2007 - 2023)
(Scroll left or right to view data)
| Year | Male Applications | % Male Applications | Female Applications | % Female Applications | Male Offers | % Male Offers | Male Offer Rate | Female Offers | % Female Offers | Female Offer Rate | Male Acceptance | % Male Acceptance | Male Acceptance Rate | Female Acceptance | % Female Acceptance | Female Acceptance Rate |
|---|---|---|---|---|---|---|---|---|---|---|---|---|---|---|---|---|
| 2023 | 11531 | 49.7% | 11680 | 50.3% | 1840 | 49.4% | 16.0% | 1881 | 50.6% | 16.1% | 1618 | 50.3% | 14.0% | 1601 | 49.7% | 13.7% |
| 2022 | 11879 | 49.9% | 11940 | 50.1% | 1774 | 48.7% | 14.9% | 1871 | 51.3% | 15.7% | 1582 | 48.4% | 13.3% | 1689 | 51.6% | 14.1% |
| 2021 | 11968 | 49.2% | 12370 | 50.8% | 1661 | 46.7% | 13.9% | 1894 | 53.3% | 15.3% | 1527 | 46.3% | 12.8% | 1771 | 53.7% | 14.3% |
| 2020 | 11712 | 50.0% | 11702 | 50.0% | 1883 | 47.9% | 16.1% | 2049 | 52.1% | 17.5% | 1761 | 46.2% | 15.0% | 2049 | 53.8% | 17.5% |
| 2019 | 11290 | 49.0% | 11736 | 51.0% | 1829 | 47.0% | 16.2% | 2066 | 53.0% | 17.6% | 1558 | 47.4% | 13.8% | 1728 | 52.6% | 14.7% |
| 2018 | 10833 | 50.3% | 10683 | 49.7% | 1901 | 49.5% | 17.5% | 1940 | 50.5% | 18.2% | 1668 | 50.4% | 15.4% | 1642 | 49.6% | 15.4% |
| 2017 | 10019 | 50.2% | 9934 | 49.8% | 1884 | 49.8% | 18.8% | 1902 | 50.2% | 19.1% | 1657 | 50.4% | 16.5% | 1628 | 49.6% | 16.4% |
| 2016 | 9615 | 50.2% | 9549 | 49.8% | 1958 | 51.9% | 20.4% | 1813 | 48.1% | 19.0% | 1723 | 52.5% | 17.9% | 1559 | 47.5% | 16.3% |
| 2015 | 9280 | 50.5% | 9110 | 49.5% | 1931 | 52.5% | 20.8% | 1745 | 47.5% | 19.2% | 1719 | 53.2% | 18.5% | 1511 | 46.8% | 16.6% |
| 2014 | 8920 | 51.0% | 8574 | 49.0% | 1907 | 53.3% | 21.4% | 1668 | 46.7% | 19.5% | 1722 | 54.3% | 19.3% | 1449 | 45.7% | 16.9% |
| 2013 | 8754 | 50.8% | 8467 | 49.2% | 1841 | 51.9% | 21.0% | 1708 | 48.1% | 20.2% | 1668 | 52.0% | 19.1% | 1538 | 48.0% | 18.2% |
| 2012 | 8771 | 50.8% | 8480 | 49.2% | 1902 | 53.6% | 21.7% | 1647 | 46.4% | 19.4% | 1735 | 53.6% | 19.8% | 1501 | 46.4% | 17.7% |
| 2011 | 8867 | 51.1% | 8479 | 48.9% | 1815 | 52.1% | 20.5% | 1666 | 47.9% | 19.6% | 1681 | 52.7% | 19.0% | 1509 | 47.3% | 17.8% |
| 2010 | 8917 | 52.0% | 8226 | 48.0% | 1938 | 55.9% | 21.7% | 1530 | 44.1% | 18.6% | 1769 | 55.9% | 19.8% | 1395 | 44.1% | 17.0% |
| 2009 | 7780 | 50.9% | 7511 | 49.1% | 1864 | 53.0% | 24.0% | 1651 | 47.0% | 22.0% | 1712 | 53.5% | 22.0% | 1489 | 46.5% | 19.8% |
| 2008 | 6905 | 50.6% | 6739 | 49.4% | 1887 | 53.3% | 27.3% | 1655 | 46.7% | 24.6% | 1699 | 50.7% | 24.6% | 1655 | 49.3% | 24.6% |
| 2007 | 7051 | 50.7% | 6855 | 49.3% | 1899 | 52.9% | 26.9% | 1694 | 47.1% | 24.7% | 1695 | 52.9% | 24.0% | 1508 | 47.1% | 22.0% |
| TOTALS | 164092 | 50.3% | 162035 | 49.7% | 31714 | 51.1% | 19.3% | 30380 | 48.9% | 18.7% | 28494 | 51.1% | 17.4% | 27222 | 48.9% | 16.8% |
Firstly, we can see the number of applications for each gender in each year. This information is essential for providing context to the offer and acceptance rates. Applications for both genders have risen at a consistent rate to each other, although more females have applied than males for the last three years of the data. In total, there were roughly 2,000 more male applicants at Oxford during this time period.
As we already know, female acceptance overtook male acceptance for the first time ever in 2019. However, there is a lot more to the story than this. Firstly, we can see that the number of offers and acceptances for males saw a gradual decrease between 2007 and 2022, with a noticeable rebound in 2023.
As for female applicants, the total acceptances have risen by around 100 places, while offers have risen by nearly 200 in this time. Despite this, there were nearly 2,000 more offers and over 1,000 more acceptances for males than females overall. This is somewhat in line with the number of applications, but the averages and success rates show that female students have still been at a slight disadvantage for some of this time period.
The average percentage of male and female offers during this time was 51.1% and 48.9%, respectively, giving males a slight edge. These figures are the same for acceptances, too.
When considering the average offer rate for males and females, we can see that 19.3% of male applicants got their offer, while 18.8% of females got theirs. For acceptance rates, this goes down to 17.4% and 16.8%, indicating a very slight level of inequality between genders.
However, on a year-by-year basis, offer and acceptance rates have been decreasing for both genders due to the increase in applications. In 2007, the female offer and acceptance rates were 24.7% and 22.0%. In 2023, these fell to 16.1% and 13.7%. The drop is even larger for male applicants, going from 26.9% and 24.0% in 2007 to 16.0% and 14.0% in 2023. While the male acceptance rate is still slightly higher, it’s clear that it’s never been harder to get into Oxford, no matter your gender.
Of course, this data comes from as early as 2007, so these inequalities are likely to shrink as more cohorts demonstrate closer success rates for male and female applicants. However, it’s still notable to see this gender divide in more recent admissions cycles, despite it being fairly minor.
Now, let’s review the same data for Cambridge, although we only have data dating back to 2014 available in this case:
Cambridge Admissions Data (2014 - 2023)
(Scroll left or right to view data)
| Year | Male Applications | % Male Applications | Female Applications | % Female Applications | Male Offers | % Male Offers | Male Offer Rate | Female Offers | % Female Offers | Female Offer Rate | Male Acceptance | % Male Acceptance | Male Acceptance Rate | Female Acceptance | % Female Acceptance | Female Acceptance Rate |
|---|---|---|---|---|---|---|---|---|---|---|---|---|---|---|---|---|
| 2023 | 10699 | 49.9% | 10746 | 50.1% | 2193 | 48.2% | 20.5% | 2360 | 51.8% | 22.0% | 1766 | 49.6% | 16.5% | 1791 | 50.4% | 16.7% |
| 2022 | 11073 | 49.3% | 11397 | 50.7% | 2079 | 49.1% | 18.8% | 2159 | 50.9% | 18.9% | 1719 | 48.5% | 15.5% | 1825 | 51.5% | 16.0% |
| 2021 | 11600 | 50.9% | 11195 | 49.1% | 2135 | 50.1% | 18.4% | 2125 | 49.9% | 19.0% | 1798 | 49.1% | 15.5% | 1862 | 50.9% | 16.6% |
| 2020 | 10581 | 51.8% | 9845 | 48.2% | 2285 | 48.5% | 21.6% | 2425 | 51.5% | 24.6% | 1901 | 47.6% | 18.0% | 2096 | 52.4% | 21.3% |
| 2019 | 10102 | 52.2% | 9257 | 47.8% | 2321 | 49.4% | 23.0% | 2373 | 50.6% | 25.6% | 1790 | 50.7% | 17.7% | 1738 | 49.3% | 18.8% |
| 2018 | 9810 | 53.4% | 8568 | 46.6% | 2299 | 50.4% | 23.4% | 2260 | 49.6% | 26.4% | 1762 | 50.9% | 18.0% | 1703 | 49.1% | 19.9% |
| 2017 | 9260 | 53.9% | 7929 | 46.1% | 2281 | 50.9% | 24.6% | 2204 | 49.1% | 27.8% | 1818 | 52.0% | 19.6% | 1679 | 48.0% | 21.2% |
| 2016 | 9068 | 54.1% | 7682 | 45.9% | 2241 | 52.0% | 24.7% | 2066 | 48.0% | 26.9% | 1791 | 51.8% | 19.8% | 1666 | 48.2% | 21.7% |
| 2015 | 8906 | 54.2% | 7525 | 45.8% | 2200 | 51.7% | 24.7% | 2053 | 48.3% | 27.3% | 1788 | 51.8% | 20.1% | 1661 | 48.2% | 22.1% |
| 2014 | 9190 | 54.9% | 7562 | 45.1% | 2246 | 53.2% | 24.4% | 1974 | 46.8% | 26.1% | 1817 | 52.7% | 19.8% | 1631 | 47.3% | 21.6% |
| TOTALS | 100289 | 52.2% | 91706 | 47.8% | 22280 | 50.3% | 22.2% | 21999 | 49.7% | 24.0% | 17950 | 50.4% | 17.9% | 17652 | 49.6% | 19.2% |
Although we have less pre-2020 data to work with for Cambridge, we can actually see fairly similar results.
One major difference is that the number of female applicants grew at a larger rate than at Oxford, starting at roughly 7,500 applicants in 2014 and growing to 10,746 in 2023. Male applications increased by less than 1,000 in the same period.
Just like at Oxford, female applications overtook male applications in 2021 (11,195 vs 11,600). Over the ten years of data, there were around 1,500 more male applicants in total.
The number of offers given also follows a similar trend to Oxford, with an increase of 400 offers between 2014 and 2023 for females and a decrease of around 200 for males from 2014 to 2022 (with a rebound of 100 in 2023). The overall difference between male and female offers at this time is lower than at Oxford, with males having under 300 more. However, keep in mind that the reduced time frame of the data makes this more likely, given the trend of increasing offers for females in the 2010s and 2020s.
When looking at acceptances, we can see that female acceptances peaked in 2020 at 2,096 (vs 1,901 for males), which was the same year that Oxford’s female acceptances peaked. While this may have been impacted by the COVID-19 pandemic, there isn’t a solid case for a connection.
When considering the success rates, we can see that males have had roughly a 1% advantage in both offers and acceptances across the ten years. However, as with Oxford, offer and acceptance rates for both genders have been falling as the competition expands. From 2014 to 2023, offer rates for both males and females fell by around 3%.
A similar decrease is also seen in male acceptance rates, but female acceptance rates actually fell by closer to 5% in the same period (21.6% to 16.7%). We already know that female applications had a sharper increase during this time, which likely explains why female acceptance rates have had a larger drop.
We now have a better understanding of the current admissions landscape at Oxford and Cambridge. However, this only covers the general intake at the universities. There are two major factors that should also be explored when it comes to the admissions process: courses and colleges.

Oxbridge 2023 Course Admissions Data (Male & Female)
Below is the full application data for every course at Oxford and Cambridge in 2023, split by male and female:
Oxford Course Admissions Data 2023
(Scroll left or right to view data)
| Course | Male Applications | % Male Applications | Female Applications | % Female Applications | Male Offers | % Male Offers | Male Offer Rate | Female Offers | % Female Offers | Female Offer Rate | Male Acceptance | % Male Acceptance | Male Acceptance Rate | Female Acceptance | % Female Acceptance | Female Acceptance Rate |
|---|---|---|---|---|---|---|---|---|---|---|---|---|---|---|---|---|
| Acient Modern History | 45 | 45.9% | 53 | 54.1% | 13 | 56.5% | 28.9% | 10 | 43.5% | 18.9% | 12 | 60.0% | 26.7% | 8 | 40.0% | 15.1% |
| AMES | 46 | 42.2% | 63 | 57.8% | 18 | 39.1% | 39.1% | 28 | 60.9% | 44.4% | 14 | 40.0% | 30.4% | 21 | 60.0% | 33.3% |
| Archaeology and Anthropology | 41 | 32.8% | 84 | 67.2% | 10 | 40.0% | 24.4% | 15 | 60.0% | 17.9% | 8 | 36.4% | 19.5% | 14 | 63.6% | 16.7% |
| Biochemistry | 327 | 37.4% | 548 | 62.6% | 45 | 39.1% | 13.8% | 70 | 60.9% | 12.8% | 37 | 37.0% | 11.3% | 63 | 63.0% | 11.5% |
| Biology | 255 | 34.4% | 487 | 65.6% | 46 | 35.9% | 18.0% | 82 | 64.1% | 16.8% | 42 | 38.5% | 16.5% | 67 | 61.5% | 13.8% |
| Biomedical Sciences | 143 | 29.2% | 347 | 70.8% | 13 | 28.3% | 9.1% | 33 | 71.7% | 9.5% | 12 | 29.3% | 8.4% | 29 | 70.7% | 8.4% |
| Chemistry | 530 | 52.2% | 485 | 47.8% | 126 | 60.9% | 23.8% | 81 | 39.1% | 16.7% | 108 | 61.7% | 20.4% | 67 | 38.3% | 13.8% |
| Classical Archaeology and Anthropology | 44 | 28.9% | 108 | 71.1% | 9 | 28.1% | 20.5% | 23 | 71.9% | 21.3% | 7 | 28.0% | 15.9% | 18 | 72.0% | 16.7% |
| Classics | 117 | 37.4% | 196 | 62.6% | 45 | 38.1% | 38.5% | 73 | 61.9% | 37.2% | 41 | 41.0% | 35.0% | 59 | 59.0% | 30.1% |
| Classics and English | 11 | 18.3% | 49 | 81.7% | 3 | 20.0% | 27.3% | 12 | 80.0% | 24.5% | 2 | 15.4% | 18.2% | 11 | 84.6% | 22.4% |
| Classics and Modern Lang | 6 | 26.1% | 17 | 73.9% | 1 | 10.0% | 16.7% | 9 | 90.0% | 52.9% | 1 | 10.0% | 16.7% | 9 | 90.0% | 52.9% |
| Computer Science | 676 | 78.1% | 190 | 21.9% | 41 | 69.5% | 6.1% | 18 | 30.5% | 9.5% | 36 | 69.2% | 5.3% | 16 | 30.8% | 8.4% |
| Computer Science and Philosophy | 76 | 58.9% | 53 | 41.1% | 9 | 60.0% | 11.8% | 6 | 40.0% | 11.3% | 8 | 66.7% | 10.5% | 4 | 33.3% | 7.5% |
| Earth Science | 78 | 47.9% | 85 | 52.1% | 19 | 45.2% | 24.4% | 23 | 54.8% | 27.1% | 16 | 47.1% | 20.5% | 18 | 52.9% | 21.2% |
| Economics and Management | 973 | 63.1% | 569 | 36.9% | 58 | 63.7% | 6.0% | 33 | 36.3% | 5.8% | 53 | 63.9% | 5.4% | 30 | 36.1% | 5.3% |
| EMES | 19 | 47.5% | 21 | 52.5% | 8 | 53.3% | 42.1% | 7 | 46.7% | 33.3% | 6 | 46.2% | 31.6% | 7 | 53.8% | 33.3% |
| Engineering Science | 778 | 75.5% | 253 | 24.5% | 151 | 77.0% | 19.4% | 45 | 23.0% | 17.8% | 129 | 79.1% | 16.6% | 34 | 20.9% | 13.4% |
| English and Modern Lang | 12 | 13.2% | 79 | 86.8% | 6 | 16.2% | 50.0% | 31 | 83.8% | 39.2% | 5 | 14.3% | 41.7% | 30 | 85.7% | 38.0% |
| English Lit and Lang | 169 | 17.3% | 806 | 82.7% | 53 | 21.3% | 31.4% | 196 | 78.7% | 24.3% | 47 | 22.2% | 27.8% | 165 | 77.8% | 20.5% |
| Experimental Psychology | 67 | 17.7% | 312 | 82.3% | 16 | 28.6% | 23.9% | 40 | 71.4% | 12.8% | 11 | 25.6% | 16.4% | 32 | 74.4% | 10.3% |
| Fine Art | 53 | 20.8% | 202 | 79.2% | 13 | 41.9% | 24.5% | 18 | 58.1% | 8.9% | 12 | 42.9% | 22.6% | 16 | 57.1% | 7.9% |
| Geography | 156 | 46.0% | 183 | 54.0% | 44 | 48.9% | 28.2% | 46 | 51.1% | 25.1% | 31 | 44.3% | 19.9% | 39 | 55.7% | 21.3% |
| History | 482 | 50.3% | 476 | 49.7% | 107 | 42.1% | 22.2% | 147 | 57.9% | 30.9% | 92 | 43.0% | 19.1% | 122 | 57.0% | 25.6% |
| History and Economics | 103 | 65.2% | 55 | 34.8% | 11 | 57.9% | 10.7% | 8 | 42.1% | 14.5% | 11 | 61.1% | 10.7% | 7 | 38.9% | 12.7% |
| History and English | 21 | 20.2% | 83 | 79.8% | 7 | 53.8% | 33.3% | 6 | 46.2% | 7.2% | 6 | 50.0% | 28.6% | 6 | 50.0% | 7.2% |
| History and Modern Language | 26 | 36.1% | 46 | 63.9% | 7 | 36.8% | 26.9% | 12 | 63.2% | 26.1% | 7 | 38.9% | 26.9% | 11 | 61.1% | 23.9% |
| History and Politics | 204 | 53.5% | 177 | 46.5% | 32 | 59.3% | 15.7% | 22 | 40.7% | 12.4% | 30 | 62.5% | 14.7% | 18 | 37.5% | 10.2% |
| History of Art | 16 | 15.0% | 91 | 85.0% | 4 | 25.0% | 25.0% | 12 | 75.0% | 13.2% | 3 | 21.4% | 18.8% | 11 | 78.6% | 12.1% |
| Human Sciences | 45 | 23.3% | 148 | 76.7% | 12 | 37.5% | 26.7% | 20 | 62.5% | 13.5% | 10 | 38.5% | 22.2% | 16 | 61.5% | 10.8% |
| Law | 630 | 33.9% | 1228 | 66.1% | 82 | 37.4% | 13.0% | 137 | 62.6% | 11.2% | 73 | 38.0% | 11.6% | 119 | 62.0% | 9.7% |
| Law/LSE | 79 | 23.2% | 262 | 76.8% | 13 | 46.4% | 16.5% | 15 | 53.6% | 5.7% | 12 | 46.2% | 15.2% | 14 | 53.8% | 5.3% |
| Material Science | 93 | 62.8% | 55 | 37.2% | 29 | 60.4% | 31.2% | 19 | 39.6% | 34.5% | 27 | 61.4% | 29.0% | 17 | 38.6% | 30.9% |
| Mathematics | 1258 | 69.6% | 549 | 30.4% | 145 | 75.1% | 11.5% | 48 | 24.9% | 8.7% | 136 | 76.0% | 10.8% | 43 | 24.0% | 7.8% |
| Maths and Comp Sci | 464 | 78.2% | 129 | 21.8% | 59 | 90.8% | 12.7% | 6 | 9.2% | 4.7% | 48 | 94.1% | 10.3% | 3 | 5.9% | 2.3% |
| Maths and Philosophy | 90 | 55.2% | 73 | 44.8% | 14 | 70.0% | 15.6% | 6 | 30.0% | 8.2% | 13 | 68.4% | 14.4% | 6 | 31.6% | 8.2% |
| Maths and Stats | 89 | 62.7% | 53 | 37.3% | 2 | 40.0% | 2.2% | 3 | 60.0% | 5.7% | 1 | 33.3% | 1.1% | 2 | 66.7% | 3.8% |
| Medicine | 642 | 37.5% | 1070 | 62.5% | 75 | 46.3% | 11.7% | 87 | 53.7% | 8.1% | 71 | 47.7% | 11.1% | 78 | 52.3% | 7.3% |
| Modern Lang | 98 | 31.7% | 211 | 68.3% | 55 | 32.2% | 56.1% | 116 | 67.8% | 55.0% | 50 | 34.5% | 51.0% | 95 | 65.5% | 45.0% |
| Modern Lang and Linguistics | 29 | 31.9% | 62 | 68.1% | 10 | 24.4% | 34.5% | 31 | 75.6% | 50.0% | 10 | 25.6% | 34.5% | 29 | 74.4% | 46.8% |
| Music | 93 | 55.0% | 76 | 45.0% | 47 | 51.6% | 50.5% | 44 | 48.4% | 57.9% | 45 | 55.6% | 48.4% | 36 | 44.4% | 47.4% |
| Philosophy and Modern Lang | 25 | 44.6% | 31 | 55.4% | 13 | 54.2% | 52.0% | 11 | 45.8% | 35.5% | 10 | 47.6% | 40.0% | 11 | 52.4% | 35.5% |
| Philosophy and Theology | 60 | 41.1% | 86 | 58.9% | 12 | 42.9% | 20.0% | 16 | 57.1% | 18.6% | 11 | 44.0% | 18.3% | 14 | 56.0% | 16.3% |
| Physics | 1096 | 73.4% | 398 | 26.6% | 151 | 79.5% | 13.8% | 39 | 20.5% | 9.8% | 137 | 78.7% | 12.5% | 37 | 21.3% | 9.3% |
| Physics and Philosophy | 84 | 60.4% | 55 | 39.6% | 9 | 60.0% | 10.7% | 6 | 40.0% | 10.9% | 6 | 50.0% | 7.1% | 6 | 50.0% | 10.9% |
| PPE | 1046 | 56.1% | 818 | 43.9% | 158 | 59.6% | 15.1% | 107 | 40.4% | 13.1% | 136 | 59.4% | 13.0% | 93 | 40.6% | 11.4% |
| PPL | 78 | 28.4% | 197 | 71.6% | 13 | 27.1% | 16.7% | 35 | 72.9% | 17.8% | 10 | 26.3% | 12.8% | 28 | 73.7% | 14.2% |
| RAMES | 2 | 66.7% | 1 | 33.3% | 0 | 0.0% | 0.0% | 1 | 100.0% | 100.0% | 0 | 0.0% | 0.0% | 1 | 100.0% | 100.0% |
| Theology and Religion | 56 | 48.3% | 60 | 51.7% | 26 | 48.1% | 46.4% | 28 | 51.9% | 46.7% | 25 | 54.3% | 44.6% | 21 | 45.7% | 35.0% |
| TOTAL | 11531 | 49.7% | 11680 | 50.3% | 1840 | 49.4% | 16.0% | 1881 | 50.6% | 16.1% | 1618 | 50.3% | 14.0% | 1601 | 49.7% | 13.7% |
Cambridge Course Admissions Data 2023
(Scroll left or right to view data)
| Course | Male Applications | % Male Applications | Female Applications | % Female Applications | Male Offers | % Male Offers | Male Offer Rate | Female Offers | % Female Offers | Female Offer Rate | Male Acceptance | % Male Acceptance | Male Acceptance Rate | Female Acceptance | % Female Acceptance | Female Acceptance Rate |
|---|---|---|---|---|---|---|---|---|---|---|---|---|---|---|---|---|
| AMES | 45 | 36.3% | 79 | 63.7% | 19 | 37.3% | 42.2% | 32 | 62.7% | 40.5% | 13 | 32.5% | 28.9% | 27 | 67.5% | 34.2% |
| Anglo-Saxon | 24 | 38.7% | 38 | 61.3% | 11 | 30.6% | 45.8% | 25 | 69.4% | 65.8% | 6 | 31.6% | 25.0% | 13 | 68.4% | 34.2% |
| Archeaology | 24 | 29.3% | 58 | 70.7% | 10 | 21.7% | 41.7% | 36 | 78.3% | 62.1% | 6 | 18.8% | 25.0% | 26 | 81.3% | 44.8% |
| Architecture | 164 | 31.4% | 358 | 68.6% | 34 | 35.4% | 20.7% | 62 | 64.6% | 17.3% | 24 | 40.0% | 14.6% | 36 | 60.0% | 10.1% |
| Chemical Engineering | 225 | 60.3% | 148 | 39.7% | 56 | 63.6% | 24.9% | 32 | 36.4% | 21.6% | 46 | 68.7% | 20.4% | 21 | 31.3% | 14.2% |
| Classics | 40 | 31.7% | 86 | 68.3% | 15 | 25.4% | 37.5% | 44 | 74.6% | 51.2% | 14 | 28.0% | 35.0% | 36 | 72.0% | 41.9% |
| Classics (4 Year) | 18 | 17.0% | 88 | 83.0% | 6 | 12.2% | 33.3% | 43 | 87.8% | 48.9% | 7 | 24.1% | 38.9% | 22 | 75.9% | 25.0% |
| Computer Science | 1307 | 82.6% | 276 | 17.4% | 114 | 77.6% | 8.7% | 33 | 22.4% | 12.0% | 95 | 78.5% | 7.3% | 26 | 21.5% | 9.4% |
| Economics | 838 | 62.7% | 498 | 37.3% | 115 | 62.8% | 13.7% | 68 | 37.2% | 13.7% | 105 | 64.8% | 12.5% | 57 | 35.2% | 11.4% |
| Education | 27 | 14.2% | 163 | 85.8% | 6 | 12.0% | 22.2% | 44 | 88.0% | 27.0% | 6 | 17.6% | 22.2% | 28 | 82.4% | 17.2% |
| Engineering | 1887 | 78.3% | 523 | 21.7% | 273 | 73.8% | 14.5% | 97 | 26.2% | 18.5% | 253 | 76.0% | 13.4% | 80 | 24.0% | 15.3% |
| English | 138 | 18.3% | 618 | 81.7% | 44 | 19.8% | 31.9% | 178 | 80.2% | 28.8% | 38 | 20.3% | 27.5% | 149 | 79.7% | 24.1% |
| Geography | 175 | 33.4% | 349 | 66.6% | 48 | 34.8% | 27.4% | 90 | 65.2% | 25.8% | 31 | 31.3% | 17.7% | 68 | 68.7% | 19.5% |
| History | 266 | 43.8% | 341 | 56.2% | 77 | 36.2% | 28.9% | 136 | 63.8% | 39.9% | 53 | 32.3% | 19.9% | 111 | 67.7% | 32.6% |
| History and Modern Languages | 30 | 34.1% | 58 | 65.9% | 12 | 32.4% | 40.0% | 25 | 67.6% | 43.1% | 11 | 35.5% | 36.7% | 20 | 64.5% | 34.5% |
| History and Politics | 159 | 46.5% | 183 | 53.5% | 34 | 47.9% | 21.4% | 37 | 52.1% | 20.2% | 32 | 47.8% | 20.1% | 35 | 52.2% | 19.1% |
| History of Art | 9 | 10.3% | 78 | 89.7% | 2 | 5.4% | 22.2% | 35 | 94.6% | 44.9% | 1 | 3.2% | 11.1% | 30 | 96.8% | 38.5% |
| HSPS | 419 | 29.2% | 1017 | 70.8% | 71 | 32.4% | 16.9% | 148 | 67.6% | 14.6% | 60 | 36.1% | 14.3% | 106 | 63.9% | 10.4% |
| Land Economy | 345 | 54.8% | 284 | 45.2% | 53 | 57.6% | 15.4% | 39 | 42.4% | 13.7% | 41 | 57.7% | 11.9% | 30 | 42.3% | 10.6% |
| Law | 539 | 34.1% | 1041 | 65.9% | 121 | 43.2% | 22.4% | 159 | 56.8% | 15.3% | 112 | 48.7% | 20.8% | 118 | 51.3% | 11.3% |
| Linguistics | 44 | 37.0% | 75 | 63.0% | 19 | 43.2% | 43.2% | 25 | 56.8% | 33.3% | 14 | 53.8% | 31.8% | 12 | 46.2% | 16.0% |
| Mathematics | 1170 | 73.7% | 418 | 26.3% | 374 | 71.4% | 32.0% | 150 | 28.6% | 35.9% | 208 | 80.6% | 17.8% | 50 | 19.4% | 12.0% |
| Medicine | 783 | 44.6% | 971 | 55.4% | 133 | 46.2% | 17.0% | 155 | 53.8% | 16.0% | 133 | 48.7% | 17.0% | 140 | 51.3% | 14.4% |
| Medicine Graduate | 186 | 33.9% | 362 | 66.1% | 19 | 42.2% | 10.2% | 26 | 57.8% | 7.2% | 17 | 42.5% | 9.1% | 23 | 57.5% | 6.4% |
| MML | 85 | 33.5% | 169 | 66.5% | 49 | 31.6% | 57.6% | 106 | 68.4% | 62.7% | 43 | 33.6% | 50.6% | 85 | 66.4% | 50.3% |
| Music | 65 | 46.4% | 75 | 53.6% | 36 | 46.2% | 55.4% | 42 | 53.8% | 56.0% | 19 | 37.3% | 29.2% | 32 | 62.7% | 42.7% |
| Natural Science | 1284 | 52.5% | 1160 | 47.5% | 357 | 57.0% | 27.8% | 269 | 43.0% | 23.2% | 313 | 57.2% | 24.4% | 234 | 42.8% | 20.2% |
| PBS | 159 | 17.8% | 732 | 82.2% | 25 | 24.0% | 15.7% | 79 | 76.0% | 10.8% | 22 | 27.2% | 13.8% | 59 | 72.8% | 8.1% |
| Philosophy | 149 | 48.7% | 157 | 51.3% | 34 | 49.3% | 22.8% | 35 | 50.7% | 22.3% | 24 | 48.0% | 16.1% | 26 | 52.0% | 16.6% |
| Theology | 30 | 28.6% | 75 | 71.4% | 9 | 19.6% | 30.0% | 37 | 80.4% | 49.3% | 7 | 18.9% | 23.3% | 30 | 81.1% | 40.0% |
| Vet Med | 65 | 19.5% | 268 | 80.5% | 17 | 18.9% | 26.2% | 73 | 81.1% | 27.2% | 12 | 16.4% | 18.5% | 61 | 83.6% | 22.8% |
| TOTAL | 10699 | 49.9% | 10746 | 50.1% | 2193 | 48.2% | 20.5% | 2360 | 51.8% | 22.0% | 1766 | 49.6% | 16.5% | 1791 | 50.4% | 16.7% |
This is a lot of information to go through, so let’s explore some of the key points:
Are Oxbridge’s Most Popular Subjects Equal?
When considering the most popular subjects at Oxford and Cambridge, we have to look at the courses with the most applications. We’ve already covered the top five courses at each university in our Oxford Acceptance Rates and Cambridge Acceptance Rates guides. However, here are the courses, complete with the admissions data for 2023, split by gender:
Top 5 Oxford Courses
(Scroll left or right to view data)
| Course | Male Applications | % Male Applications | Female Applications | % Female Applications | Male Offers | % Male Offers | Male Offer Rate | Female Offers | % Female Offers | Female Offer Rate | Male Acceptance | % Male Acceptance | Male Acceptance Rate | Female Acceptance | % Female Acceptance | Female Acceptance Rate |
|---|---|---|---|---|---|---|---|---|---|---|---|---|---|---|---|---|
| PPE | 1046 | 56.1% | 818 | 43.9% | 158 | 59.6% | 15.1% | 107 | 40.4% | 13.1% | 136 | 59.4% | 13.0% | 93 | 40.6% | 11.4% |
| Law | 630 | 33.9% | 1228 | 66.1% | 82 | 37.4% | 13.0% | 137 | 62.6% | 11.2% | 73 | 38.0% | 11.6% | 119 | 62.0% | 9.7% |
| Mathematics | 1258 | 69.6% | 549 | 30.4% | 145 | 75.1% | 11.5% | 48 | 24.9% | 8.7% | 136 | 76.0% | 10.8% | 43 | 24.0% | 7.8% |
| Medicine | 642 | 37.5% | 1070 | 62.5% | 75 | 46.3% | 11.7% | 87 | 53.7% | 8.1% | 71 | 47.7% | 11.1% | 78 | 52.3% | 7.3% |
| Economics and Management | 973 | 63.1% | 569 | 36.9% | 58 | 63.7% | 6.0% | 33 | 36.3% | 5.8% | 53 | 63.9% | 5.4% | 30 | 36.1% | 5.3% |
Top 5 Cambridge Courses
(Scroll left or right to view data)
| Course | Male Applications | % Male Applications | Female Applications | % Female Applications | Male Offers | % Male Offers | Male Offer Rate | Female Offers | % Female Offers | Female Offer Rate | Male Acceptance | % Male Acceptance | Male Acceptance Rate | Female Acceptance | % Female Acceptance | Female Acceptance Rate |
|---|---|---|---|---|---|---|---|---|---|---|---|---|---|---|---|---|
| Natural Science | 1284 | 52.5% | 1160 | 47.5% | 357 | 57.0% | 27.8% | 269 | 43.0% | 23.2% | 313 | 57.2% | 24.4% | 234 | 42.8% | 20.2% |
| Engineering | 1887 | 78.3% | 523 | 21.7% | 273 | 73.8% | 14.5% | 97 | 26.2% | 18.5% | 253 | 76.0% | 13.4% | 80 | 24.0% | 15.3% |
| Medicine | 783 | 44.6% | 971 | 55.4% | 133 | 46.2% | 17.0% | 155 | 53.8% | 16.0% | 133 | 48.7% | 17.0% | 140 | 51.3% | 14.4% |
| Mathematics | 1170 | 73.7% | 418 | 26.3% | 374 | 71.4% | 32.0% | 150 | 28.6% | 35.9% | 208 | 80.6% | 17.8% | 50 | 19.4% | 12.0% |
| Computer Science | 1307 | 82.6% | 276 | 17.4% | 114 | 77.6% | 8.7% | 33 | 22.4% | 12.0% | 95 | 78.5% | 7.3% | 26 | 21.5% | 9.4% |
At Oxford, we can see that the top subjects are fairly unbalanced in the rates of males and females, although there is a variance in which gender is more dominant in each. Medicine and Law both have predominantly female cohorts, while PPE, Maths and Economics & Management have more male students.
However, we also need to consider the actual success rates for each gender. For E&M, females made up 37% of the applicant pool, but also made up 36% of the offers and acceptances. Acceptance rates were also similar between males and females (5.5% and 5.3%), showing that the admissions process was fairly balanced between genders.
In other subjects, this balance becomes more skewed towards male applicants, including Medicine. Despite making up 62.5% of the applicant pool for the course, only 52.4% of female applicants were accepted – a drop of over 10%. This means that males were accepted at an unproportional rate onto the course.
The same can be seen in Cambridge’s most popular courses, although there are two instances of the data skewing towards female applicants. Engineering and Computer Science saw two of the least balanced application rates between male and female applicants. However, despite female applicants making up just 21.7% and 17.4% of the applicant pools respectively, they actually made up 24.0% and 21.5% of the total acceptances for that year. While it’s not a major increase, it does demonstrate that female students can sometimes have better odds of success, especially when the female applicant pool is smaller.
However, these aren’t the most extreme examples of unbalanced gender ratios in courses. We can see that there are various courses at each university that are dominated by male or female students. Let’s see what they are and try to understand why this is the case:
Oxford’s Male-Dominated Courses
The following courses are being described as male/female-dominated due to the proportion of male or female students being 75% or higher in the 2023 intake (RAMES has been excluded from this group due to the abnormally small number of applicants and acceptances). This data only covers one year of admissions and does not represent the whole cohort size across three years:
- Engineering Science: 129 vs 34 (79.1% male)
- Mathematics: 136 vs 43 (76.0% male)
- Maths and Computer Science: 48 vs 3 (94.1% male)
- Physics: 137 vs 37 (78.7% male)
Oxford’s Female-Dominated Courses
- Classics and English: 11 vs 2 (84.6% Female)
- Classics and Modern Languages: 9 vs 1 (90.0% Female)
- English Literature and Language: 165 vs 47 (77.8% Female)
- English and Modern Languages: 30 vs 5 (85.7% Female)
- History of Art: 11 vs 3 (78.6% Female)
There is a very clear divide that can be seen here, showing that more female students gravitate toward humanities subjects, while males dominate the STEM field. This isn’t anything new, though, and these divides are caused by the rates of applications for each gender more than any other factor. When there are fewer applicants from one gender for a course, the final admissions are going to feature greater representation for the larger group.
The only major subject that is predominantly made of female students is English, which has over 200 new students per year. However, three of the four male-dominated courses are major STEM courses, indicating that these fields still lack some female representation.
Cambridge’s Male-Dominated Courses
- Computer Science: 95 vs 26 (78.5% male)
- Engineering: 253 vs 80 (76.0% male)
- Mathematics: 208 vs 50 (80.6% male)
Cambridge’s Female-Dominated Courses
- History of Art: 30 vs 1 (96.8% Female)
- Veterinary Medicine: 61 vs 12 (83.6% Female)
- Education: 28 vs 6 (82.4% Female)
- Archaeology: 26 vs 6 (81.3% Female)
- Theology: 30 vs 7 (81.1% Female)
- English: 149 vs 38 (79.7% Female)
- Classics (4 Years): 22 vs 7 (75.9% Female)
A very similar story can be seen here, although there are fewer male-dominated degrees and more female-dominated ones. English is once again made up of mostly female students, while Maths and Engineering remain primarily male. Computer Science is the only other male-dominated course, which has extremely low acceptance rates for both genders. At Oxford, 30% of the Computer Science cohort was female, which is still a fairly low proportion.
The last thing to consider in this data is the divide between male and female students’ acceptance rates on certain courses. In some cases, the divide can be very large, indicating an imbalance in the admissions process. Let’s review these cases next:
Largest Divides Between Male and Female Acceptance Rates for Oxford Courses
- Ancient and Modern History: 26.7% Male vs 15.1% Female
- Classics and Modern Languages: 52.9% Female vs 16.7% Male
- History and English: 28.6% Male vs 7.23% Female
- Human Sciences: 22.2% Male vs 10.8% Female
- Fine Art: 22.6% Male vs 7.9% Female
- Law/LSE: 15.2% Male vs 5.3% Female
- Maths and Computer Science: 10.3% Male vs 2.3% Female
- Modern Languages and Linguistics: 46.8% Male vs 34.5% Male
- Theology and Religion: 44.64% Male vs 35.0% Female
Largest Divides Between Male and Female Acceptance Rates for Cambridge Courses
- Anglo-Saxon, Norse, and Celtic: 34.1% Female vs 25.0% Male
- Archaeology: 44.8% Female vs 25.0% Male
- Music: 42.7% Female vs 29.3% Male
- Theology: 40.0% Female vs 23.3% Male
- History of Art: 38.5% Female vs 11.1% Male
- History: 32.6% Female vs 19.92% Male
- Classics (4 Year): 38.9% Male vs 25.0% Female
- Linguistics: 31.8% Male vs 16.0% Female
- Law: 20.8% Male vs 11.3% Female
There are a lot of subjects that feature a large divide between male and female applicants, including various major courses like Law and History. This data can be especially significant in cases where there were more female applicants than male ones. It indicates that female applicants may still have a harder time getting places of major degrees, even ones that are predominantly female, although this is only in the context of gender and not overall admissions.
Overall, how equal is the admissions process at these universities across all subjects? Firstly, we can see that there are more courses across both universities that are dominated by female students. However, while many of these courses are less popular ones, most of the courses dominated by male students at Oxbridge are very notable STEM courses (Maths, Engineering, Computer Science, etc).
While this is mostly down to the far greater number of male applicants, we can see that female applicants still aren’t being admitted proportionally when compared to their male counterparts in many cases.
This isn’t to say that these departments still maintain any form of bias or unfair practice, nor that they should be required to admit a perfectly equal amount of male and female students. Also, this statistic isn’t the most important thing for the applicants themselves to consider. Applicants are not assessed based on their gender but on their merits as an applicant, which means they are competing against the whole cohort rather than just those of the same gender. As such, the overall offer and acceptance rates for a course are more valuable data.
However, when the data is split by gender, it is clear that female representation in certain sectors is still very low. Beyond this, we can see that, across all courses, males have a higher chance of being accepted across more individual subjects, despite the overall acceptance rates being fairly similar.

Less than 16% of Oxbridge applicants got their place, but 59% of UniAdmissions students got their Oxbridge offer.
Average success rates for Oxford and Cambridge applicants are low, but effective preparation is the key to standing out from the competition and beating the odds. UniAdmissions students benefit from comprehensive support that lets them focus on the areas that are most important to them, ensuring they are submitting a well-rounded application.
Discover our Full-Blue Programme by clicking the button below to learn how you can enrol and triple your chances of success.
Oxbridge 2023 College Admissions Data (Male & Female)
The gender divide between admissions on courses is generally the topic most people will be more interested in, but understanding this same information for the colleges at Oxford and Cambridge is also important. Despite Oxford only being fully co-ed for less than ten years (and Cambridge still housing two women’s colleges), both universities have seemingly found an equal balance between male and female admissions.
However, that isn’t to say that there isn’t disparity in this area of the admissions process too, so let’s examine the college admissions statistics for 2023 entry:
Oxford College Admissions Data 2023
(Scroll left or right to view data)
| College | Male Applications | % Male Applications | Female Applications | % Female Applications | Male Offers | % Male Offers | Male Offer Rate | Female Offers | % Female Offers | Female Offer Rate | Male Acceptance | % Male Acceptance | Male Acceptance Rate | Female Acceptance | % Female Acceptance | Female Acceptance Rate |
|---|---|---|---|---|---|---|---|---|---|---|---|---|---|---|---|---|
| Balliol | 591 | 57.8% | 431 | 42.2% | 74 | 56.9% | 12.5% | 56 | 43.1% | 13.0% | 67 | 57.8% | 11.3% | 49 | 42.2% | 11.4% |
| Brasenose | 449 | 43.0% | 596 | 57.0% | 61 | 48.4% | 13.6% | 65 | 51.6% | 10.9% | 53 | 47.3% | 11.8% | 59 | 52.7% | 9.9% |
| Christ | 502 | 49.9% | 504 | 50.1% | 76 | 49.4% | 15.1% | 78 | 50.6% | 15.5% | 60 | 45.5% | 12.0% | 72 | 54.5% | 14.3% |
| Corpus Christi | 220 | 50.3% | 217 | 49.7% | 44 | 55.7% | 20.0% | 35 | 44.3% | 16.1% | 38 | 56.7% | 17.3% | 29 | 43.3% | 13.4% |
| Exeter | 317 | 45.5% | 380 | 54.5% | 48 | 42.1% | 15.1% | 66 | 57.9% | 17.4% | 41 | 41.0% | 12.9% | 59 | 59.0% | 15.5% |
| Harris Manchester | 78 | 56.9% | 59 | 43.1% | 27 | 64.3% | 34.6% | 15 | 35.7% | 25.4% | 22 | 71.0% | 28.2% | 9 | 29.0% | 15.3% |
| Hetford | 414 | 50.5% | 406 | 49.5% | 55 | 42.3% | 13.3% | 75 | 57.7% | 18.5% | 52 | 46.0% | 12.6% | 61 | 54.0% | 15.0% |
| Jesus | 439 | 57.2% | 328 | 42.8% | 64 | 52.0% | 14.6% | 59 | 48.0% | 18.0% | 55 | 51.4% | 12.5% | 52 | 48.6% | 15.9% |
| Keble | 631 | 53.1% | 558 | 46.9% | 75 | 54.7% | 11.9% | 62 | 45.3% | 11.1% | 64 | 54.2% | 10.1% | 54 | 45.8% | 9.7% |
| Lady Margaret | 253 | 38.3% | 407 | 61.7% | 51 | 39.8% | 20.2% | 77 | 60.2% | 18.9% | 46 | 38.7% | 18.2% | 73 | 61.3% | 17.9% |
| Lincoln | 267 | 43.1% | 353 | 56.9% | 40 | 38.8% | 15.0% | 63 | 61.2% | 17.8% | 37 | 40.7% | 13.9% | 54 | 59.3% | 15.3% |
| Magdalen | 475 | 39.3% | 735 | 60.7% | 55 | 45.1% | 11.6% | 67 | 54.9% | 9.1% | 48 | 48.0% | 10.1% | 52 | 52.0% | 7.1% |
| Mansfield | 201 | 48.8% | 211 | 51.2% | 36 | 40.4% | 17.9% | 53 | 59.6% | 25.1% | 33 | 44.0% | 16.4% | 42 | 56.0% | 19.9% |
| Merton | 324 | 51.2% | 309 | 48.8% | 52 | 48.1% | 16.0% | 56 | 51.9% | 18.1% | 42 | 45.7% | 13.0% | 50 | 54.3% | 16.2% |
| New | 512 | 48.7% | 539 | 51.3% | 67 | 49.6% | 13.1% | 68 | 50.4% | 12.6% | 65 | 52.4% | 12.7% | 59 | 47.6% | 10.9% |
| Oriel | 290 | 54.6% | 241 | 45.4% | 63 | 60.0% | 21.7% | 42 | 40.0% | 17.4% | 55 | 60.4% | 19.0% | 36 | 39.6% | 14.9% |
| Pembroke | 381 | 51.6% | 357 | 48.4% | 61 | 48.8% | 16.0% | 64 | 51.2% | 17.9% | 54 | 52.9% | 14.2% | 48 | 47.1% | 13.4% |
| Regent’s Park | 55 | 40.1% | 82 | 59.9% | 15 | 37.5% | 27.3% | 25 | 62.5% | 30.5% | 16 | 45.7% | 29.1% | 19 | 54.3% | 23.2% |
| Somerville | 321 | 45.3% | 387 | 54.7% | 58 | 42.6% | 18.1% | 78 | 57.4% | 20.2% | 54 | 46.6% | 16.8% | 62 | 53.4% | 16.0% |
| St Anne’s | 326 | 47.2% | 365 | 52.8% | 63 | 45.3% | 19.3% | 76 | 54.7% | 20.8% | 51 | 41.5% | 15.6% | 72 | 58.5% | 19.7% |
| St Catherine’s | 525 | 56.8% | 400 | 43.2% | 98 | 57.6% | 18.7% | 72 | 42.4% | 18.0% | 85 | 59.0% | 16.2% | 59 | 41.0% | 14.8% |
| St Edmund | 353 | 53.3% | 309 | 46.7% | 68 | 56.2% | 19.3% | 53 | 43.8% | 17.2% | 63 | 60.0% | 17.8% | 42 | 40.0% | 13.6% |
| St Hilda’s | 317 | 48.5% | 336 | 51.5% | 65 | 45.5% | 20.5% | 78 | 54.5% | 23.2% | 58 | 48.7% | 18.3% | 61 | 51.3% | 18.2% |
| St Hugh’s | 380 | 51.8% | 354 | 48.2% | 71 | 52.2% | 18.7% | 65 | 47.8% | 18.4% | 59 | 51.3% | 15.5% | 51 | 48.7% | 15.8% |
| St John’s | 591 | 54.7% | 489 | 45.3% | 77 | 52.0% | 13.0% | 71 | 48.0% | 14.5% | 68 | 59.6% | 11.5% | 56 | 40.4% | 11.5% |
| St Peter’s | 356 | 58.4% | 254 | 41.6% | 66 | 55.5% | 18.5% | 53 | 44.5% | 20.9% | 57 | 55.3% | 16.0% | 46 | 44.7% | 18.1% |
| The Queen’s | 285 | 43.2% | 374 | 56.8% | 50 | 45.0% | 17.5% | 61 | 55.0% | 16.3% | 45 | 45.9% | 15.8% | 53 | 54.1% | 14.2% |
| Trinity | 365 | 52.9% | 325 | 47.1% | 51 | 53.7% | 14.0% | 44 | 46.3% | 13.5% | 45 | 52.3% | 12.3% | 41 | 47.7% | 12.6% |
| University | 476 | 54.5% | 397 | 45.5% | 70 | 52.2% | 14.7% | 64 | 47.8% | 16.1% | 61 | 52.6% | 12.8% | 55 | 47.4% | 13.9% |
| Wadham | 359 | 45.7% | 427 | 54.3% | 70 | 50.7% | 19.5% | 68 | 49.3% | 15.9% | 61 | 50.8% | 17.0% | 59 | 49.2% | 13.8% |
| Worcester | 468 | 46.0% | 549 | 54.0% | 58 | 45.0% | 12.4% | 71 | 55.0% | 12.9% | 52 | 44.1% | 11.1% | 66 | 55.9% | 12.0% |
| Wycliffe | 8 | 88.9% | 1 | 11.1% | 9 | 90.0% | 112.5% | 1 | 10.0% | 100.0% | 9 | 90.0% | 112.5% | 1 | 10.0% | 100.0% |
| TOTAL | 11529 | 49.7% | 11680 | 50.3% | 1838 | 49.4% | 15.9% | 1881 | 50.6% | 16.1% | 1616 | 50.2% | 14.0% | 1601 | 49.8% | 13.7% |
What can we see from this data regarding Oxford’s college admissions? Firstly, we can see that most colleges don’t have a very large variance between male and female admissions, with most having less than a 20% difference. Across the selection, 15 colleges admitted more women than men, while 17 did the opposite. This is a fairly balanced result, although it skews slightly in favour of male applicants.
Looking at the single-sex acceptance rates for each college, we can see that females had a higher rate of entry in 14 colleges versus 18 for males. Again, this slightly favours male applicants but isn’t too extreme. For most colleges, the difference between male and female acceptance rates is only 3% – 5%, which is also not too significant. However, there are a handful of more extreme examples in the data, so let’s review them:
Largest Gender Gaps Between Male and Female Students at Oxford Colleges
Harris Manchester College
Male to Female Student Ratio: 71:29
Acceptance Rates: Male: 28.2%, Female: 15.3%
Lady Margaret College
Male to Female Student Ratio: 39:61
Acceptance Rates: Male: 18.2%, Female: 17.9%
Wycliffe Hall
Male to Female Student Ratio: 9:1
Acceptance Rates: Male: 112.5%, Female: 100.0%
The first two examples here aren’t too extreme but do demonstrate a potential bias towards male applicants at Harris Manchester due to the gap of over 10% in acceptance rates for male and female students. The gender divide at Lady Margaret is caused by the larger volume of female applicants for the college, as the acceptance rates between male and female students are fairly consistent (although male applicants did have a slight edge, a common trend when an applicant pool is smaller).
The data from Wycliffe Hall is far more unusual and is a fairly big outlier in this case. According to the data, 8 males and 1 female applied to study at the college, which only teaches Theology and Religion at an undergraduate level. Of these applicants, all of them were admitted, plus an additional student who had not applied to the college (this could be due to an open application or a different college send one of their applicants there).
Overall, we can see that college admissions are far less varied when it comes to male and female admissions, with a decent balance being met between the two genders. You can learn more about Oxford Colleges in our dedicated guide, or see the general success rates in our Oxford College Acceptance Rate Guide. Let’s now review Cambridge’s colleges to see if this is the case there as well.
Cambridge College Admissions Data 2023
Cambridge has fewer colleges than Oxford: just 31 in total, with two of them not admitted undergraduates. Of the 29 remaining colleges, two of these are single-sex, only admitting female students (Murray Edwards College and Newnham College). How does this impact admissions at the rest of the university’s colleges? Let’s find out:
(Scroll left or right to view data)
| College | Male Applications | % Male Applications | Female Applications | % Female Applications | Male Offers | % Male Offers | Male Offer Rate | Female Offers | % Female Offers | Female Offer Rate | Male Acceptance | % Male Acceptance | Male Acceptance Rate | Female Acceptance | % Female Acceptance | Female Acceptance Rate |
|---|---|---|---|---|---|---|---|---|---|---|---|---|---|---|---|---|
| Christ’s | 436 | 53.6% | 377 | 46.4% | 83 | 52.5% | 19.0% | 75 | 47.5% | 19.9% | 68 | 56.2% | 15.6% | 53 | 43.8% | 14.1% |
| Churchill | 571 | 73.1% | 210 | 26.9% | 94 | 52.5% | 16.5% | 85 | 47.5% | 40.5% | 68 | 50.4% | 11.9% | 67 | 49.6% | 31.9% |
| Clare | 376 | 41.4% | 532 | 58.6% | 76 | 43.4% | 20.2% | 99 | 56.6% | 18.6% | 65 | 45.8% | 17.3% | 77 | 54.2% | 14.5% |
| Corpus Christi | 282 | 52.1% | 259 | 47.9% | 62 | 52.1% | 22.0% | 57 | 47.9% | 22.0% | 45 | 54.9% | 16.0% | 37 | 45.1% | 14.3% |
| Downing | 491 | 47.6% | 541 | 52.4% | 87 | 53.7% | 17.7% | 75 | 46.3% | 13.9% | 72 | 56.3% | 14.7% | 56 | 43.8% | 10.4% |
| Emmanuel | 423 | 49.2% | 437 | 50.8% | 90 | 55.6% | 21.3% | 72 | 44.4% | 16.5% | 76 | 54.7% | 18.0% | 63 | 45.3% | 14.4% |
| Fitzwilliam | 448 | 56.9% | 339 | 43.1% | 90 | 48.9% | 20.1% | 94 | 51.1% | 27.7% | 74 | 51.7% | 16.5% | 69 | 48.3% | 20.4% |
| Girton | 374 | 57.8% | 273 | 42.2% | 85 | 47.2% | 22.7% | 95 | 52.8% | 34.8% | 65 | 46.8% | 17.4% | 74 | 53.2% | 27.1% |
| Gonville and Caius | 427 | 51.9% | 395 | 48.1% | 93 | 48.2% | 21.8% | 100 | 51.8% | 25.3% | 75 | 51.0% | 17.6% | 72 | 49.0% | 18.2% |
| Homerton | 514 | 54.1% | 436 | 45.9% | 99 | 46.7% | 19.3% | 113 | 53.3% | 25.9% | 87 | 50.9% | 16.9% | 84 | 49.1% | 19.3% |
| Hughes Hall | 165 | 50.9% | 159 | 49.1% | 42 | 57.5% | 25.5% | 31 | 42.5% | 19.5% | 33 | 61.1% | 20.0% | 21 | 38.9% | 13.2% |
| Jesus | 483 | 50.1% | 481 | 49.9% | 77 | 52.4% | 15.9% | 70 | 47.6% | 14.6% | 76 | 53.9% | 15.7% | 65 | 46.1% | 13.5% |
| King’s | 490 | 53.2% | 431 | 46.8% | 88 | 56.4% | 18.0% | 68 | 43.6% | 15.8% | 70 | 55.6% | 14.3% | 56 | 44.4% | 13.0% |
| Lucy Cavendish | 316 | 45.9% | 373 | 54.1% | 85 | 44.7% | 26.9% | 105 | 55.3% | 28.2% | 72 | 49.3% | 22.8% | 74 | 50.7% | 19.8% |
| Magdalene | 301 | 55.8% | 238 | 44.2% | 64 | 52.5% | 21.3% | 58 | 47.5% | 24.4% | 56 | 56.0% | 18.6% | 44 | 44.0% | 18.5% |
| Murray Edwards | 0 | 0.0% | 417 | 100.0% | 0 | 0.0% | #DIV/0! | 163 | 100.0% | 39.1% | 0 | 0.0% | #DIV/0! | 110 | 100.0% | 26.4% |
| Newnham | 0 | 0.0% | 651 | 100.0% | 0 | 0.0% | #DIV/0! | 168 | 100.0% | 25.8% | 0 | 0.0% | #DIV/0! | 121 | 100.0% | 18.6% |
| Pembroke | 507 | 48.6% | 536 | 51.4% | 75 | 46.3% | 14.8% | 87 | 53.7% | 16.2% | 57 | 45.2% | 11.2% | 69 | 54.8% | 12.9% |
| Peterhouse | 262 | 59.8% | 176 | 40.2% | 50 | 48.5% | 19.1% | 53 | 51.5% | 30.1% | 38 | 45.2% | 14.5% | 46 | 54.8% | 26.1% |
| Queens’ | 462 | 51.7% | 432 | 48.3% | 102 | 53.4% | 22.1% | 89 | 46.6% | 20.6% | 76 | 51.4% | 16.5% | 72 | 48.6% | 16.7% |
| Robinson | 340 | 61.5% | 213 | 38.5% | 77 | 54.6% | 22.6% | 64 | 45.4% | 30.0% | 60 | 50.0% | 17.6% | 60 | 50.0% | 28.2% |
| Selwyn | 368 | 48.1% | 397 | 51.9% | 77 | 47.5% | 20.9% | 85 | 52.5% | 21.4% | 58 | 47.9% | 15.8% | 63 | 52.1% | 15.9% |
| Sidney Sussex | 309 | 52.3% | 282 | 47.7% | 75 | 54.7% | 24.3% | 62 | 45.3% | 22.0% | 58 | 54.2% | 18.8% | 49 | 45.8% | 17.4% |
| St Catherine’s | 331 | 43.9% | 423 | 56.1% | 92 | 54.1% | 27.8% | 78 | 45.9% | 18.4% | 74 | 52.5% | 22.4% | 67 | 47.5% | 15.8% |
| St Edmund’s | 137 | 46.4% | 158 | 53.6% | 41 | 55.4% | 29.9% | 33 | 44.6% | 20.9% | 29 | 53.7% | 21.2% | 25 | 46.3% | 15.8% |
| St. John’s | 608 | 51.2% | 580 | 48.8% | 108 | 49.5% | 17.8% | 110 | 50.5% | 19.0% | 85 | 53.5% | 14.0% | 74 | 46.5% | 12.8% |
| Trinity | 872 | 62.4% | 525 | 37.6% | 181 | 69.3% | 20.8% | 80 | 30.7% | 15.2% | 139 | 70.6% | 15.9% | 58 | 29.4% | 11.0% |
| Trinity Hall | 276 | 46.8% | 314 | 53.2% | 61 | 45.9% | 22.1% | 72 | 54.1% | 22.9% | 54 | 51.4% | 19.6% | 51 | 48.6% | 16.2% |
| Wolfson | 130 | 44.7% | 161 | 55.3% | 39 | 67.2% | 30.0% | 19 | 32.8% | 11.8% | 36 | 72.0% | 27.7% | 14 | 28.0% | 8.7% |
| TOTAL | 10699 | 49.9% | 10746 | 50.1% | 2193 | 48.2% | 20.5% | 2360 | 51.8% | 22.0% | 1766 | 49.6% | 16.5% | 1791 | 50.4% | 16.7% |
Overall, the admissions statistics here are once again fairly equal. Unlike Oxford, female applicants actually had a higher overall acceptance rate in 2023. However, looking at colleges individually, most colleges favoured male applicants.
Across the 29 colleges, just 9 admitted more females and males. If you remove the two women’s colleges, this drops to just 7 predominantly female colleges versus 20 for males. Although this feels imbalanced, the actual acceptance rates between genders display a bit more consistency. Of the 29 colleges, females had a higher rate of acceptance at 12, versus 18 for males.
Though this still shows an imbalance between the two genders, it seems that the female applicant pool is not spread as wide as it was at Oxford. This can potentially be explained by the existence of two single-sex colleges, though this doesn’t explain the whole picture.
Despite this, there were actually more cases of large gender gaps than at Oxford, so let’s break them down:
Largest Gender Gaps Between Male and Female Students at Cambridge Colleges
Churchill College
Male to Female Student Ratio: 50:50
Acceptance Rates: Male: 11.9%, Female 31.9%
Hughes Hall
Male to Female Student Ratio: 61:39
Acceptance Rates: Male: 20.0%, Female: 13.2%
St Catherine’s College
Male to Female Student Ratio: 52:48
Acceptance Rates: Male: 22.4%, Female: 15.8%
St Edmund’s College
Male to Female Student Ratio: 54:46
Acceptance Rates: Male: 21.2%, Female: 15.8%
Trinity College
Male to Female Student Ratio: 71:29
Acceptance Rates: Male 15.9%, Female: 11.1%
Wolfson College
Male to Female Student Ratio: 72:28
Acceptance Rates: Male: 27.7%, Female: 8.7%
Here, we can see a variety of cases of imbalance within college admissions (Newnham and Murray Edwards are not covered here as the reasoning for the imbalance is due to the nature of the colleges). Three of these cases, Churchill, St Catherine’s and St Edmund’s, relate to a large difference between each gender’s acceptance rates while maintaining similar total acceptances.
These cases are more difficult to understand, as there aren’t immediately clear reasons as to why male or female students would have a better chance of success. The same can also be said of the case for Hughes Hall, which has a fairly unbalanced student ratio as well as a large gap between male and female success rates.
However, the two most extreme cases come from Trinity and Wolfson. Trinity is one of the most popular colleges at Cambridge and one of the hardest to get into. As we can see from the data, less than 30% of the students admitted in 2023 were female, but the acceptance rates were not too disproportional between genders. This divide is most likely due to Trinity’s reputation in STEM teaching, especially Maths, which we have already established is less popular with female applicants.
As for Wolfson, the case is a bit more complicated. Wolfson is a college for mature students and is known for being one of the most culturally diverse colleges at Cambridge. However, this diversity doesn’t seem to extend to gender, as it had the largest divide between male and female students on both counts.
Most notably, Wolfson had the lowest acceptance rate out of any college for female applicants and the highest for males. This is made even more impactful by the fact that there were 30 more female applicants to this college than males. Although the reasoning isn’t clear, it seems that female applicants were at a clear disadvantage when applying to this college in 2023.
If we look at previous years, we can see that 2023 may have been an outlier, as the statistics become less extreme from 2022 to 2020.
| 2022 | 2021 | 2020 | |
|---|---|---|---|
| % Male Acceptances | 59.5% | 63.5% | 57.6% |
| % Female Acceptances | 40.5% | 36.5% | 42.4% |
| Male Acceptance Rate | 14.6% | 24.1% | 22.4% |
| Female Acceptance Rate | 8.7% | 13.9% | 23.1% |
Although the college admits more men than women each year, the divide was smaller in previous years. Plus, in 2020, females actually had a slightly higher acceptance rate than males, indicating that there isn’t an inherent bias at the college. It remains to be seen if these extreme results will be replicated in the next admissions cycle.
If you want to learn more about the colleges at Cambridge, discover our Cambridge College Guide, or explore the overall acceptance rates in our Cambridge College Acceptance Rate Guide here.

Conclusion
We’ve explored a lot of data in this guide, so let’s summarise what we’ve learnt. In the broadest sense, the data indicates that in 2023, admissions at Oxbridge were generally very balanced and fair between males and females. Comparing Oxford and Cambridge, we can say that Oxford admissions favoured Males slightly, while females had a very slight edge at Cambridge. However, the differences on display are fairly insignificant overall.
It’s when we dive deeper into that data that we can begin to where males and females excel more in the admissions process, though these examples usually aren’t too extreme either. However, it’s clear that, at both universities, female applicants still favour humanities courses, while males gravitate towards STEM; something that is mirrored by the admissions teams in many cases.
Although this is the basic summary of the data, we can see that the division isn’t so simple and that there is generally a greater leaning towards success for male applicants at each university, although this is minor. Male applicants tend to have a slightly better outcome in the admissions processes for the more popular and competitive courses, while many niche humanities degrees admit more female students.
This notion is demonstrated through both the student totals and the acceptance rates for males and females. At both universities, there were more courses that favoured males than females in both of these metrics, although the difference wasn’t always very large.
This same can be said for college admissions. Although there are far fewer cases of colleges being dominated by a single gender, there is still a slight leaning towards male applicants in these metrics.
However, remember that these metrics aren’t as important to the actual admissions process as they may seem. Applicants are not segregated or judged by gender, so the most important pieces of data to consider are the overall offer and acceptance rates for a course or college. The male and female acceptance rates are more valuable when looking at past admissions cycles rather than looking at future ones, as they do not provide any reliable forecast.
This means that, while this data is useful to consider, especially for courses and colleges with more extreme divides, the average applicant shouldn’t be too concerned by anything we have discussed in this guide. Generally speaking, gender bias has been eliminated from the admissions process, and procedures have been put in place for applicants who feel they were treated unfairly because of their gender, race or any other personal attribute outside of what’s relevant to their course.
The key message we have to share is that applicants should send their applications with confidence regardless of any data shared here. As long as you’ve put the work in and are genuinely motivated to enter your chosen field, it’s not impossible for anyone to get their offer. Success statistics from previous years help to temper expectations and illustrate how competitive the process can be, but you will always have a chance of success if you put the work in and submit an application.
We hope this guide has provided some helpful insight into the Oxbridge admissions process and has helped to inspire your application. We wish you the very best of luck no matter where you apply to!
Less than 16% of Oxbridge applicants got their place, but 59% of UniAdmissions students got their Oxbridge offer.
No matter who you are, the chances of getting an offer are extremely low. However, with support from UniAdmissions, you can triple those chances while becoming an ideal applicant and student. Our Full-Blue Programmes tprovide world-class application support from start to finish, including expert resources, unlimited one-to-one tuition sessions, intensive courses and much more.
Discover our Full-Blue Programme by clicking the button below to learn how you can enrol and triple your chances of success.


