If you’re applying to study at the University of Cambridge or Imperial College London, you may need to sit the Engineering and Science Admissions Test (ESAT) during the process. The ESAT is designed to test applicants on their scientific knowledge, so getting a good score is an important part of impressing the admissions tutors at the university/college.
But how is the test scored, and what’s considered a good score? In this guide, we’ll explore these questions and look at results from previous years to understand what score you should be aiming for when sitting the ESAT. Let’s begin!
ESAT Scores 2024/25
The ESAT Results for the October 2024 and January 2025 sittings have been released. You can learn more about them here:
How Is The ESAT Scored?
Let’s start by looking at the scoring system for the ESAT. If you’re applying to the following courses at the University of Cambridge or Imperial College London, this will be important for you:
Cambridge ESAT Courses
We detail the format of the ESAT more in our ESAT Basics Guide, but the important thing you need to know is that the ESAT is split into five sections:
- Mathematics 1
- Mathematics 2
- Physics
- Chemistry
- Biology
Each applicant will only need to take three of these five sections, including Mathematics 1 and two additional ones (either chosen by the applicant or pre-determined if applying to certain degrees like Engineering).
Each of these sections features 27 Multiple-Choice Questions, which is where your base marks will come from. In the ESAT, each multiple-choice question is worth one mark, meaning there is a total of 27 marks available for each section and 81 marks for the whole test.
Naturally, you will earn one mark for each question you get correct on the test. The ESAT doesn’t have any negative marking, so you won’t lose marks for incorrect answers. However, the raw marks you get do not make up your final score.
The raw marks for each section are converted within a scale into a final score ranging from 1.0 (lowest) to 9.0 (highest), counted to one decimal place. You will receive a unique score for each section, but you may also receive a final score that combines your results from all three sections.
As to how these scores will be converted, the convention table is currently not publicly available. However, one aspect that we will consider next is how the ESAT marking scheme is practically identical to the NSAA and ENGAA.
We know what a good ESAT score is and how to get you one
At UniAdmissions, we have spent over 10 years preparing students for many different admissions tests, as well as the other aspects of their application. Our comprehensive curriculum is the secret to finding success in any area of the application process, including the ESAT.
Discover our ESAT Support below and find out how you can enrol and triple your chances of success.
ESAT Results 2024
The results for the first sitting of the ESAT (in October of 2024) were released to students on November 27th 2024. Alongside this, UAT UK published a document detailing the performance of the cohort overall.
This document does not feature a breakdown of the overall scores for all applicants, as it would be unrepresentative to compare all the different combinations of subtests that applicants could have taken in one table. Instead, we have a breakdown of each subtest and how well the applicants performed, so let’s take a look:
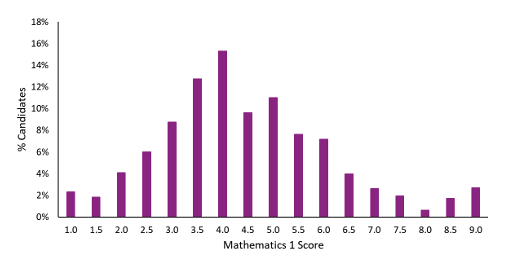
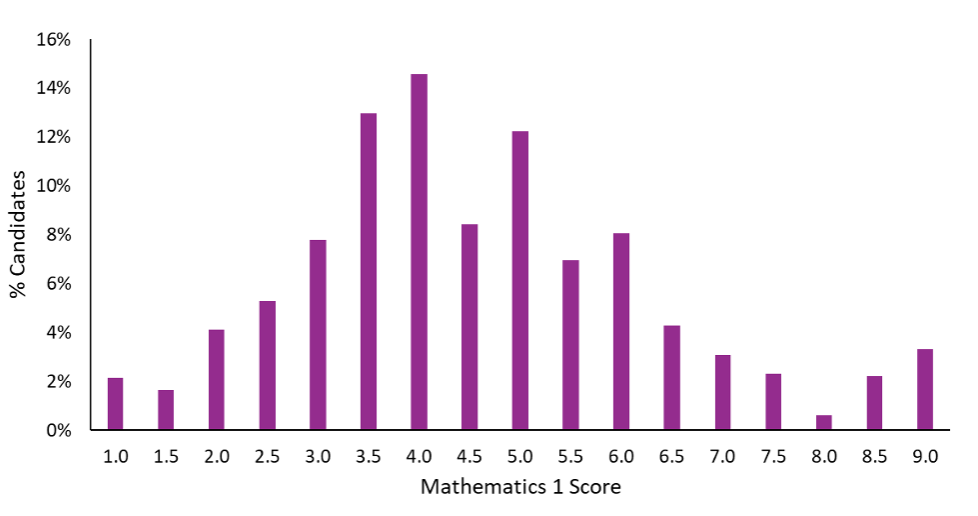
ESAT Results Mathematics 1 2024/25
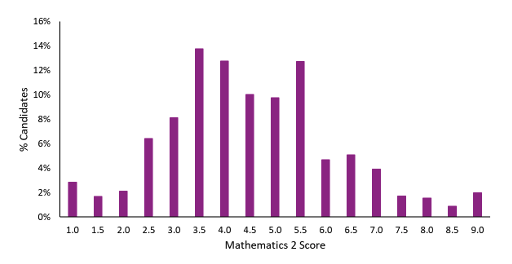
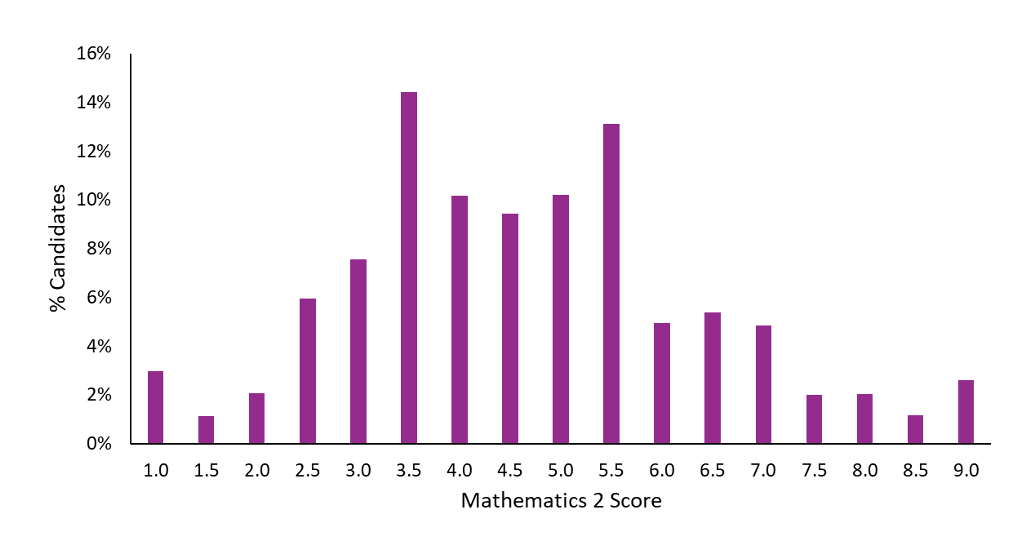
ESAT Results Mathematics 2 2024/25
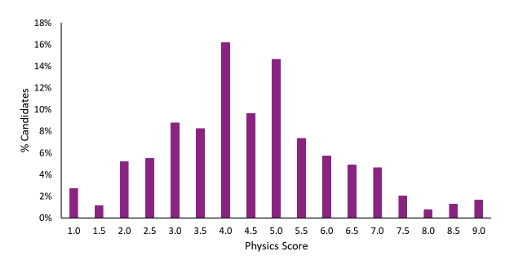
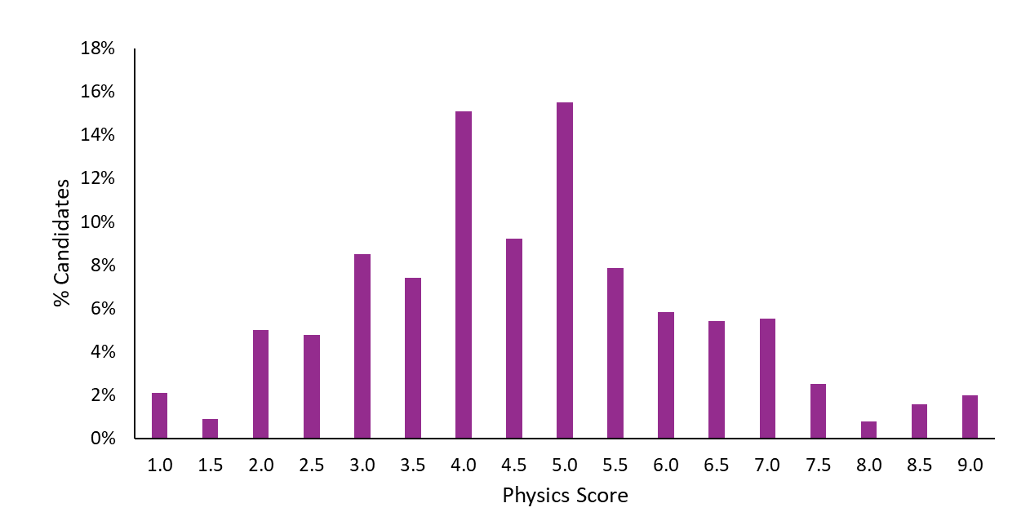
ESAT Results Physics 2024/25
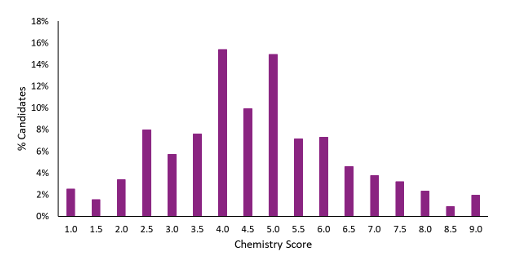
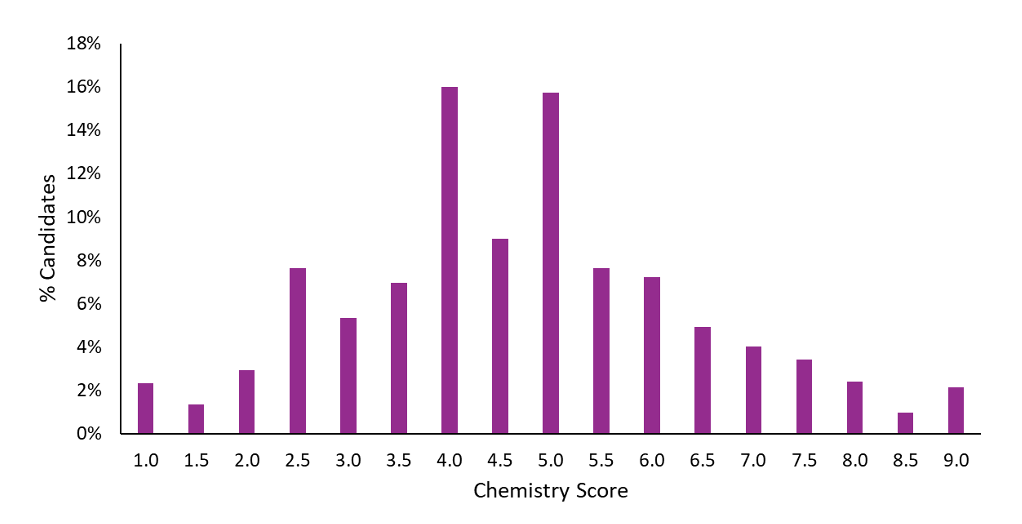
ESAT Results Chemistry 2024/25
ESAT Results Biology 2024/25
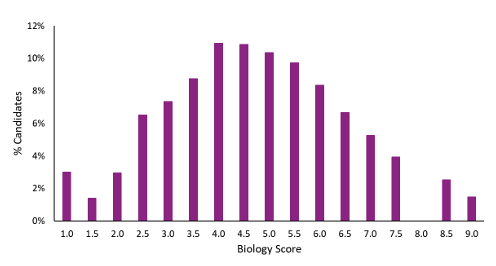
What can we learn from these graphs? To clarify, these graphs display the percentage of applicants that achieved each score (rounded to the nearest 0.5). This allows us to see which scores were gotten by the most applicants.
It’s also important to note that, due to the score conversions used for the test, 1.0 and 9.0 each represent multiple different marks, as each subtest will have a cut-off where the score cannot go higher or lower. That means that more applicants will have achieved these scores even if they got different final marks at the top and bottom ends of the scale.
For each subtest, we can see that the most common score was almost always 4.0, with the exception of Mathematics 2, which had a modal score of 3.5. Anywhere from 10% – 16% of applicants scored 4.0 in each subtest, so it is the most common score overall. In the results document, UAT claims that the test was designed so that a typical applicant would score 4.5, but this clearly isn’t the case in any of the subtests. In fact, 4.5 is commonly not even the second most common score.
This data shows a combination of both sittings of the ESAT, but data was previously published that shows the results for the October 2024 sitting alone. This data can be seen below:
ESAT Results Mathematics 1 2024
ESAT Results Mathematics 2 2024
ESAT Results Physics 2024
ESAT Results Chemistry 2024
ESAT Results Biology 2024
Many of these charts look very similar from the overall results charts, although there are a few notable differences. We can see that the October Physics cohort had a modal score of 5.0 rather than 4.0, indicating that the second paper was harder. We can also see lower scores in the October Mathematics 2 paper versus the overall results.
Which ESAT Subtest is Easiest?
This information may be evidence that Physics was the easiest subtest of the ESAT for this sitting. However, we should also consider Biology, as the number of applicants scoring between 4.0 and 5.5 is much more consistent (about 10% of applicants achieved each score).
However, despite this consistency, Biology actually had the least amount of applicants score in this range – roughly 39% versus nearly 50% of students who scored in the same range for Chemistry (the highest amount of applicants to score in this range for the sitting).
The curve on the chart for Biology remains fairly smooth until 7.5, but the number of applicants scoring in this range isn’t exceptionally higher than other subtests. Therefore, it’s difficult to pinpoint exactly which subtest was easiest, although Physics and Chemistry both have evidence to point towards being the easiest.
Which ESAT Subtest is Hardest?
The charts for each subtest all remain fairly consistent in their score distributions, so there isn’t one obviously harder subtest compared to the rest at first glance. However, when looking at the specification content, it’s clear that Mathematics 2 is likely the most difficult subtest, as it covers topics at a higher level than the other subtests.
The data here also supports this claim, as Mathematics 2 saw the least amount of applicants scoring between 6.0 and 9.0 (which we would consider to be the range for decent and good scores). It also had potentially the most applicants scoring between 1.0 and 3.5, although Mathematics 1 also saw a similar amount of applicants in this range.
Overall, what this data shows us is that the Mathematics subtests were harder than the science subtests, so be sure to keep this in mind if you’re sitting the ESAT and have a choice of which subtests to complete.
Interesting ESAT Statistics
- On average, 2% of applicants achieved a score of 9.0 in each subtest. Mathematics 1 had the most 9.0 applicants - roughly 3%.
- Mathematics 2 had the lowest most common score, just 3.5, which was achieved by around 14% of applicants.
- 8.0 and 8.5 were the two least common scores across the five subtests, No applicants achieved a score of 8.0 in the Biology subtest!
ESAT vs NSAA: Scoring
The Natural Sciences Admissions Assessment (NSAA) and Engineering Admissions Assessment (ENGAA) were the two admissions tests used by the University of Cambridge prior to 2024. These were discontinued after 2023, and the ESAT took their place, but there are many similarities between the tests, including the scoring system.
Both tests operated on a nearly identical scoring system to the ESAT, taking raw marks from the questions and converting them into a score between 1.0 and 9.0. The only difference is the number of questions within each section, as the NSAA only had 20. This will impact how the conversions are made by making the spectrum broader.
Although the scoring standards may be different for the ESAT (we currently do not have a conversion table to judge this), the method of scoring is the same, so we can look at the NSAA to predict how the ESAT will be judged.
To do this, let’s look at the conversion table for the last NSAA exam to be sat in 2023:
NSAA Conversion Table 2023 - Section 1
| S1 Maths Raw | S1 Maths Reported | S1 Physics Raw | S1 Physics Reported | S1 Chemistry Raw | S1 Chemistry Reported | S1 Biology Raw | S1 Biology Reported |
|---|---|---|---|---|---|---|---|
| 0 | 1.0 | 0 | 1.0 | 0 | 1.0 | 0 | 1.0 |
| 1 | 1.0 | 1 | 1.0 | 1 | 1.0 | 1 | 1.0 |
| 2 | 1.0 | 2 | 1.0 | 2 | 1.0 | 2 | 1.0 |
| 3 | 1.0 | 3 | 1.0 | 3 | 1.0 | 3 | 1.0 |
| 4 | 1.5 | 4 | 1.0 | 4 | 1.0 | 4 | 1.0 |
| 5 | 2.0 | 5 | 1.1 | 5 | 1.0 | 5 | 1.2 |
| 6 | 2.4 | 6 | 1.8 | 6 | 1.5 | 6 | 2.1 |
| 7 | 2.8 | 7 | 2.5 | 7 | 2.1 | 7 | 2.9 |
| 8 | 3.1 | 8 | 3.1 | 8 | 2.7 | 8 | 3.6 |
| 9 | 3.5 | 9 | 3.7 | 9 | 3.2 | 9 | 4.3 |
| 10 | 3.8 | 10 | 4.3 | 10 | 3.8 | 10 | 5.0 |
| 11 | 4.2 | 11 | 4.8 | 11 | 4.3 | 11 | 5.6 |
| 12 | 4.5 | 12 | 5.4 | 12 | 4.9 | 12 | 6.3 |
| 13 | 4.9 | 13 | 6.0 | 13 | 5.4 | 13 | 6.9 |
| 14 | 5.3 | 14 | 6.7 | 14 | 6.0 | 14 | 7.6 |
| 15 | 5.7 | 15 | 7.4 | 15 | 6.6 | 15 | 8.4 |
| 16 | 6.2 | 16 | 8.1 | 16 | 7.3 | 16 | 9.0 |
| 17 | 6.7 | 17 | 9.0 | 17 | 8.1 | 17 | 9.0 |
| 18 | 7.5 | 18 | 9.0 | 18 | 9.0 | 18 | 9.0 |
| 19 | 8.6 | 19 | 9.0 | 19 | 9.0 | 19 | 9.0 |
| 20 | 9.0 | 20 | 9.0 | 20 | 9.0 | 20 | 9.0 |
As you can see, each section has its own unique conversion rates due to the varying difficulties of the questions in each. Both the NSAA and ENGAA (which use the same conversion system) were paper-based tests, meaning all of the questions were identical for every applicant, but this may not be the case for the ESAT.
The ESAT is a computer-based test run by Pearson VUE, who operate exams like the University Clinical Aptitude Test (UCAT). In that test, questions are randomly selected from a bank of thousands, so a similar system may be put into place for the ESAT. If so, this will raise questions as to how scores can be accurately and fairly converted.
Once more information regarding this system is available, we will update this guide to inform you of how it works.
Access "The Oxbridge Application Vault"
- 300+ page ebook for Oxbridge Applicants
- 25 page ebook for Personal Statement
- 2h+ online course to succeed in any exam
- Online Oxbridge Success Calculator
- 12 page ebook about UniAdmissions

Access "The Big Book Of Oxbridge Applications" For FREE
The ESAT is just one part of your Cambridge application. Discover everything you need to know about the whole process in The Big Book Of Oxbridge Applications, available for free here! Through over 350 pages, you will find:
- Over 40 admissions test practice questions
- 28 example Oxbridge Personal Statements
- Interviews with Oxbridge students and graduates
- Additional downloadable resources
Fill in your details below to claim your digital copy today!
What Is A Good ESAT Score?
Next, let’s consider what a good ESAT score would be. Once again, this information will be based on the NSAA and ENGAA as the ESAT has yet to be sat.
Although conversions changed slightly from year to year, the standards for what a good score was remained the same from year to year, we’ll assume these standards will remain the same for ESAT test takers.
Good ESAT Score
In previous years, a good NSAA/ENGAA score was usually considered to be 7.0 or higher. Due to how competitive Cambridge is, applicants need to be in the upper echelons of the competition to stand out. A score of 7.0 or higher was generally less common, meaning those who achieved it had a much better chance of success.
In some cases, a score of 6.0 – 7.0 is also a decent score, but 7.0 is the point where an applicant can feel confident in getting an interview.
Average ESAT Score
In the NSAA and ENGAA, many applicants achieved a score between 4.0 and 7.0, meaning a score in the range would give you an average result. The actual average score of all test takes tends to skew on the lower end, but achieving a score higher than 4.0 would be considered average in the context of Cambridge admissions. These scores certainly aren’t bad, but since you scored in the same range as most other applicants, you’re far less likely to stand out. However, since Cambridge generally interviews 70% of its candidates, you still have a decent chance of being invited.
Low ESAT Score
If 4.0 is the lowest score for an average applicant, anything less than this would be considered a low score. If you achieve a score in this range, you will need to be prepared to not be invited for an interview. While some applicants still are invited (and sometimes even admitted), getting a low score makes your chances of success much less likely.
The good news is that, since most applicants score higher than this, your chances of getting a low score are actually less likely, assuming you’ve prepared for the test properly.
Bear in mind that the scores only relate to Cambridge admissions, as Cambridge was the only university to use these admissions tests previously. Imperial College London will be using the ESAT as well, but we can assume that the scoring standard will remain the same as it is also a very competitive university.
However, these are generally considered to be the tiers of NSAA – and therefore ESAT – scores, but how did we come to this conclusion? We can visualise how each cohort of test takers performed thanks to the distribution charts provided by test organisers, let’s take a look.
Past ESAT Results
We’ve already seen the first and only set of ESAT results currently available, but we can instead look at NSAA and ENGAA results from previous years. Let’s start off with the NSAA:
NSAA Results 2021
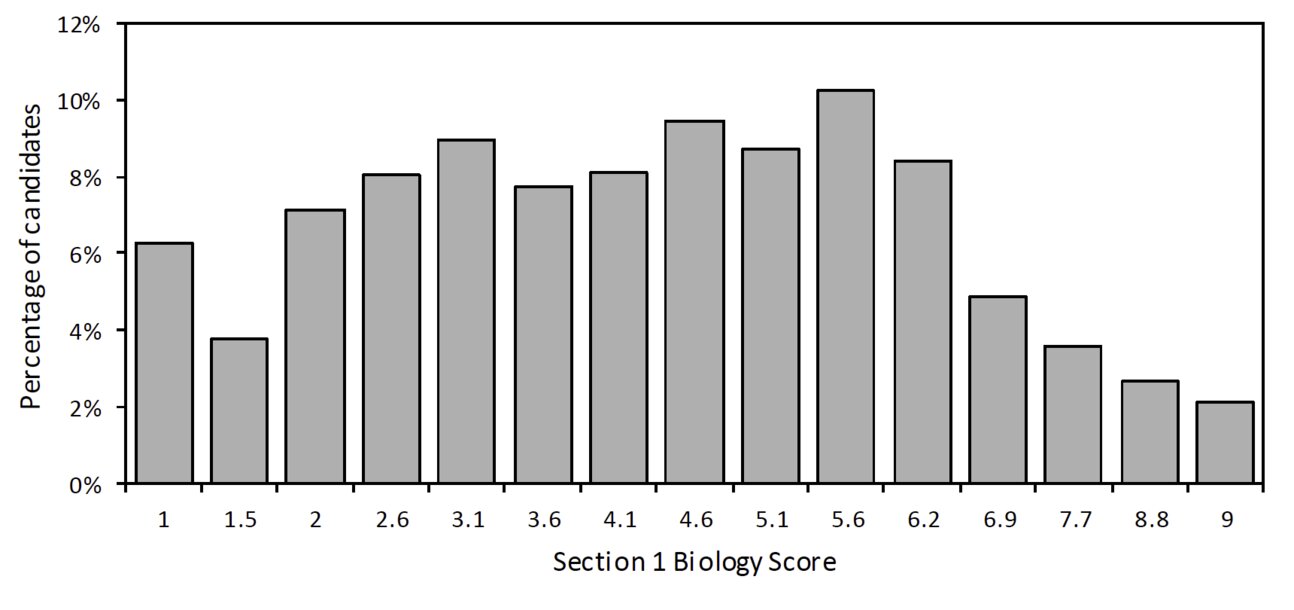
Unfortunately, we do not have the results from the 2023 sitting of the NSAA publicly available, so we’ll need to go two years back to view the 2021 results. Below are a series of graphs detailing the distribution of scores from every test taker (we are only looking at the Section 1 scores as Section 2 of the NSAA isn’t relevant to the ESAT):
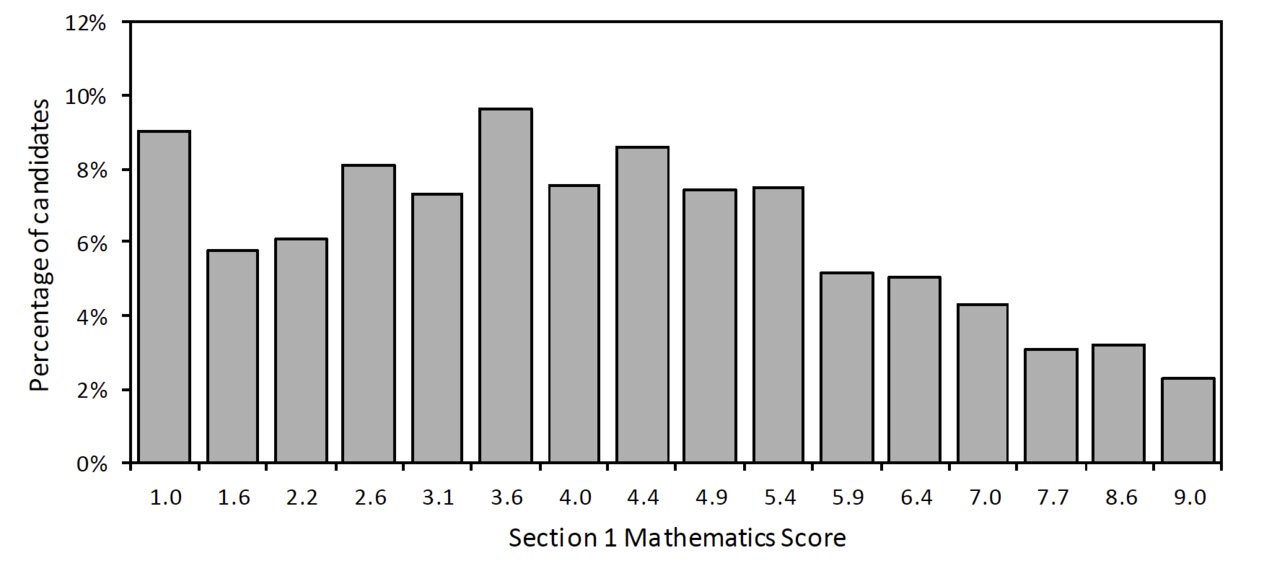
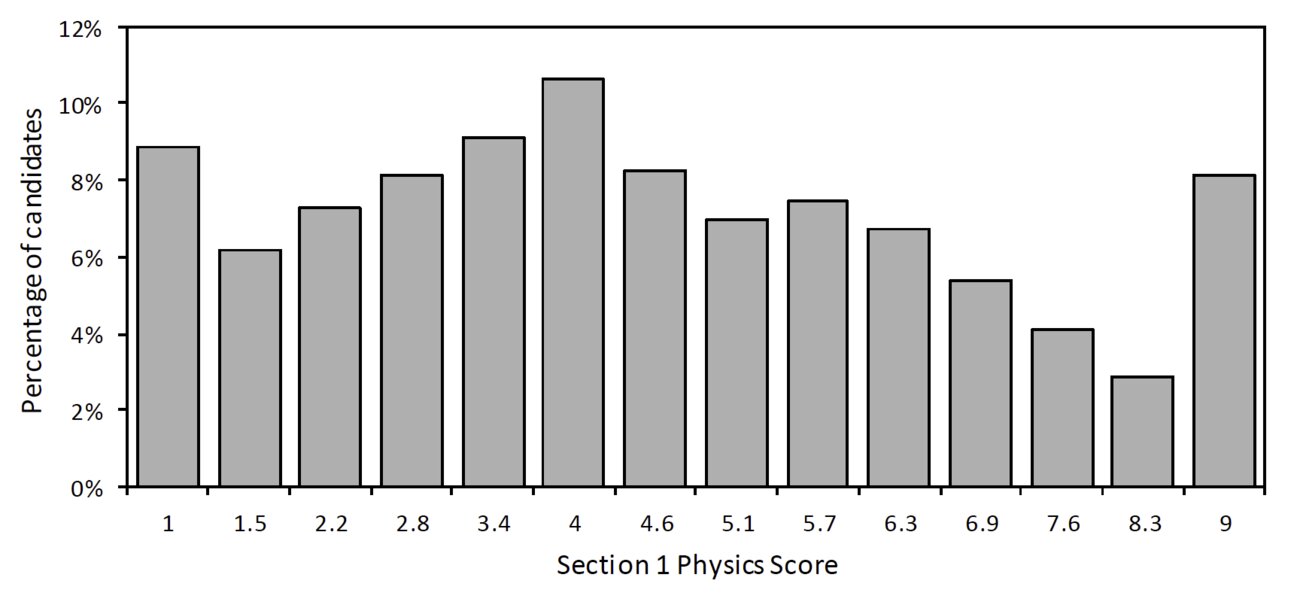
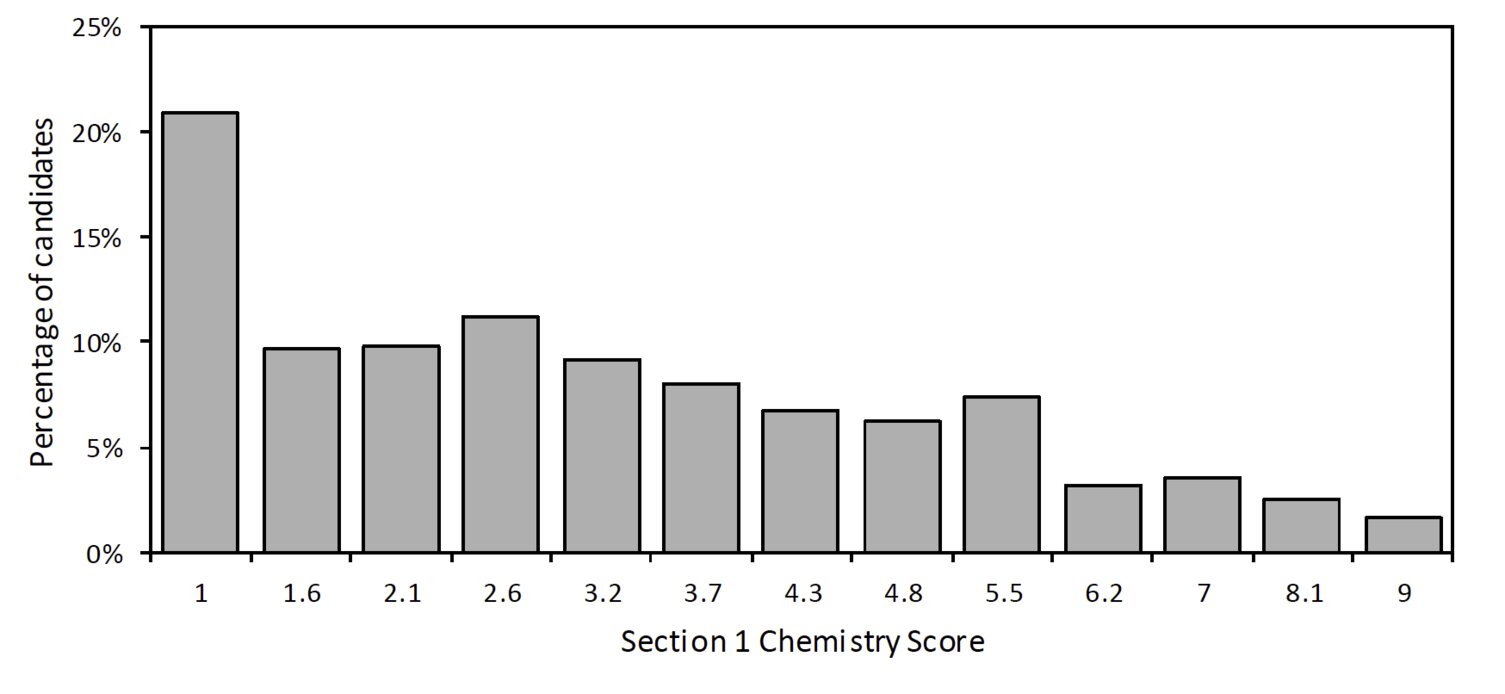
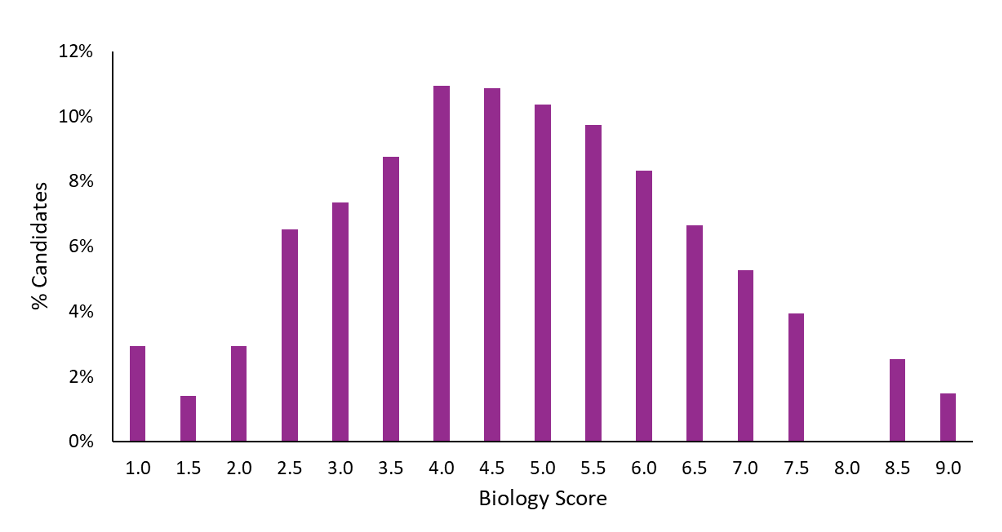
Each graph gives us an insight into how easy or difficult each section was based on the results of the applicants. In each section, we can see a fairly large portion of applicants achieved a score of 1.0, especially in the Chemistry section, in which over 20% of applicants scored 1.0. It’s clear that this was the hardest section of the test.
However, in the Physics Section, around 8% of applicants actually achieved a score of 9.0, meaning this section was slightly easier than normal. The most modal score for this section was 4.0, while the modal score for Biology was 5.6, skewing higher without major outliers like in Physics.
Overall, these results show how varied the different subject in a test can be and how much the score conversion can impact results.
Next, we have the results for Section 1 of the ENGAA, sat in 2023:
ENGAA Results 2023
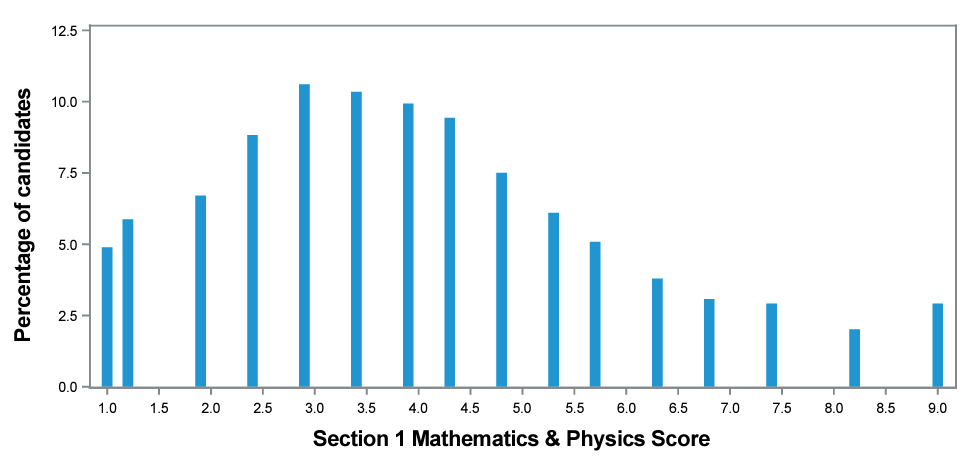
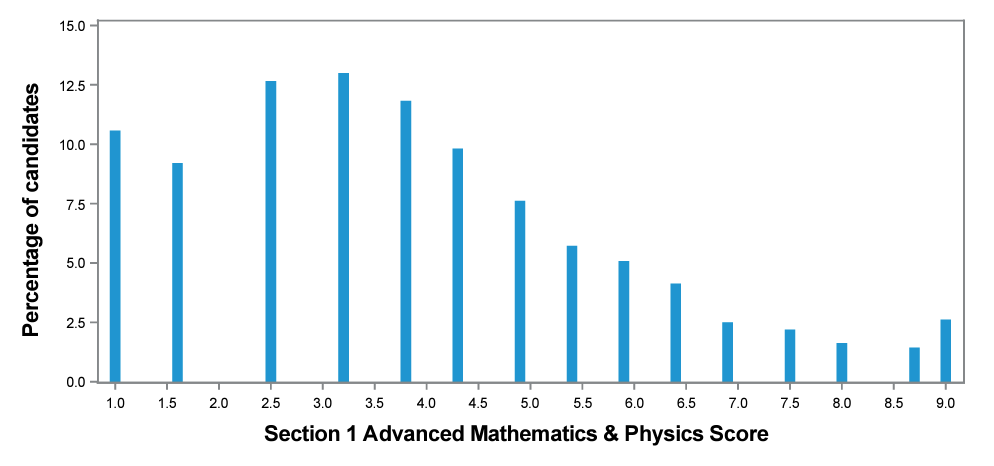
Here, the curves are more consistent but the average score skews even lower, with a modal score of around 3.0 in each subsection. Previous year’s ENGAA results have skewed more central than this, so this indicated that the 2023 sitting of the ENGAA was particularly difficult for applicants.
So, what does this mean for the ESAT? Right now, we can’t tell exactly how the results for the ESAT will look, but since the test is so similar to the ENGAA and especially the NSAA, we are expecting to see a results graph that looks similar to what was seen in previous years. However, we will only know for sure once the test is actually sat and the results are released.
When Are ESAT Results Released?
ESAT results are due to be released roughly six weeks after the test is sat. This means that those taking the test in October should expect their results starting from the 25th of November, while those taking the January sitting will get theirs starting from the 17th of February.
However, the universities will get your results much sooner as they will need them when shortlisting applicants. It’s unknown when the results summary will be released for all applicants, though it is likely to be after results have been sent to individual applicants.
That concludes our look into ESAT scoring and results. Be sure to check back on this guide once the first round of data has been released, as we will be able to better analyse what score you should be aiming for in the test. Until then, be sure to check out our other ESAT guides or explore our ESAT support if you’d like to access comprehensive support for the test that will ensure you achieve a score that will help you stand out. Good luck with your preparation!
Get the ESAT score you need and earn your offer with support from UniAdmissions
Our ESAT Programme has been designed using our knowledge of Oxbridge and the previous admissions test to provide the most effective support for the ESAT. Through tuition, courses and expert resources, you’ll have everything you need to find ESAT success.
Discover our ESAT Support below and find out how you can enrol and triple your chances of success.