Please be aware that the PAT is currently undergoing a format change. The PAT will now be computer-based and there will only be Multiple-Choice Questions in the test. Some of the information in this guide is out of date and will be fully updated once full information about the new PAT scoring system is released.
When applying to Oxford to study a Physics-based subject, the PAT is an important step of the application process.
Like any other Admissions Test, the PAT is one part of your university application so doing well in it is important. So understanding how the PAT is scored and your results presented to you will be one less weight to bear.
Which is why we have put together this guide going over everything you need to know about the scoring and results of the PAT.
How is the PAT Scored?
The PAT has always been scored out of 100 marks, with your final score being converted into a percentage. However, how those points are distributed has changed due to the format update which removed all written questions in favour of multiple-choice questions.
With 100 marks available, the PAT will feature 40 questions overall. Within the test, each question is worth either 2 or 3 marks based on the difficulty of the question. This is based on the practice test that Oxford has released for the PAT, although one 4-mark question was also present in the test.
Beyond this, there isn’t much else to learn about this marking scheme as it’s incredibly simple due to the nature of the test. There is no negative marking in the PAT, therefore you will will not lose any of the marks you have accumulated.
Pre-interview R-Scores
The department of Physics at Oxford has a specific system in place for shortlisting applicants for interviews. This involves calculating an R-score based on the elements of their application pre-interview. The calculation goes as follows:
R-score pre-interview = PAT mark + 10 x cGCSE
In this calculation, any negative cGCSE scores are omitted. An applicant needs to achieve a score of over 70% to be invited to interview, although applicants with contextual considerations will be considered as well if their score is slightly below this. As well as this, the score may sometimes be disregarded if an applicant’s application shows promise despite not achieving the required score.
Searching for PAT support to boost your score?
The PAT is a vital component of your Oxford application so scoring highly can mean the difference between an offer or rejection.
Discover our PAT Support, including in relevant Full-Blue Programmes, by clicking the button below to enrol and triple your chances of success.
When do you get your PAT results?
Firstly, you will likely be wondering when do you actually get your results.
Applicants will sit the PAT on either the 22nd or 23rd of October 2024. PAT scores will be distributed to all applicants for Materials Science and Engineering, and to all unsuccessful applicants for Physics and Physics and Philosophy, shortly after college decision letters are sent in January.
The Oxford college you are applying to will already have your results, so there is nothing you need to do after sitting the test.
past PAT Scores
With the basics of PAT scoring out of the way, let’s now look at some actual results to see what we can learn from previous years.
Although these historical results will give us a good insight into how applicants generally scored out of 100 on the test, bear in mind that these results are based on a different format of the PAT test, which featured a mixture of both multiple-choice and longer written questions. With the current format of the PAT only using multiple-choice questions (as of 2024), it’s likely that we’ll see a change in the results compared to previous years.
Let’s start by looking at the score distributions for the last four years of the PAT.
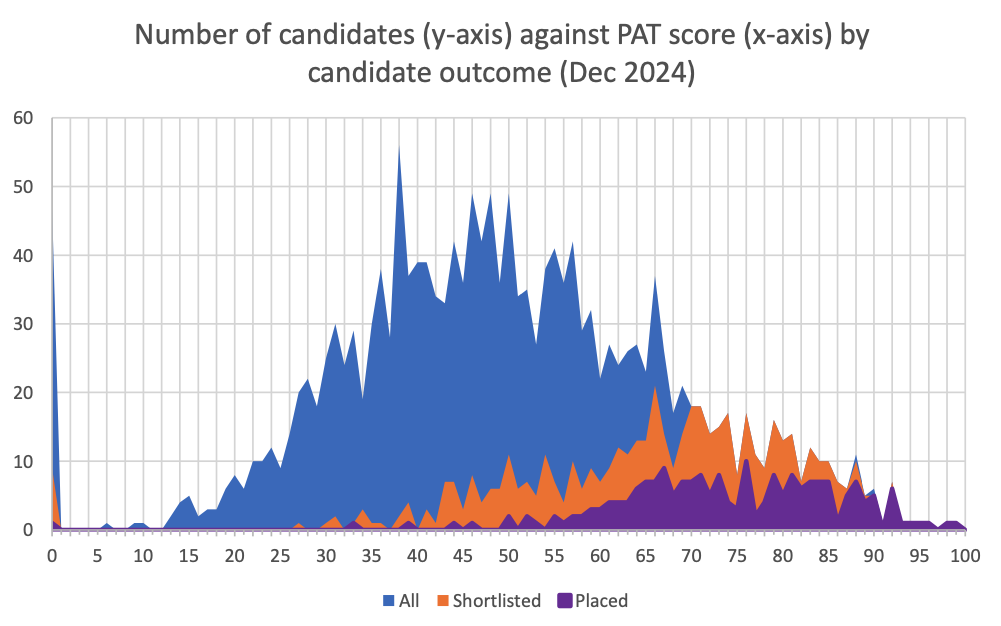
PAT Results 2024
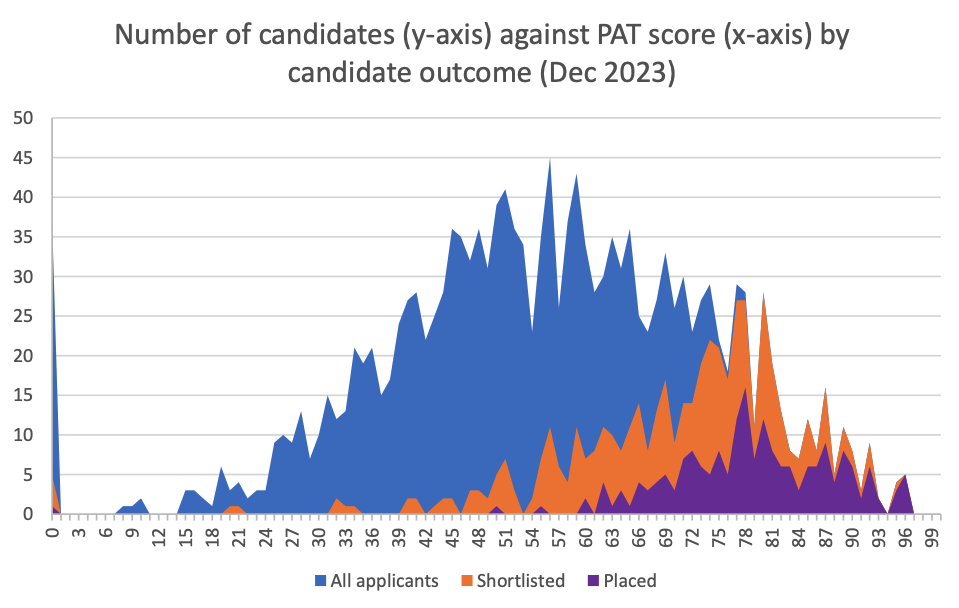
PAT Results 2023
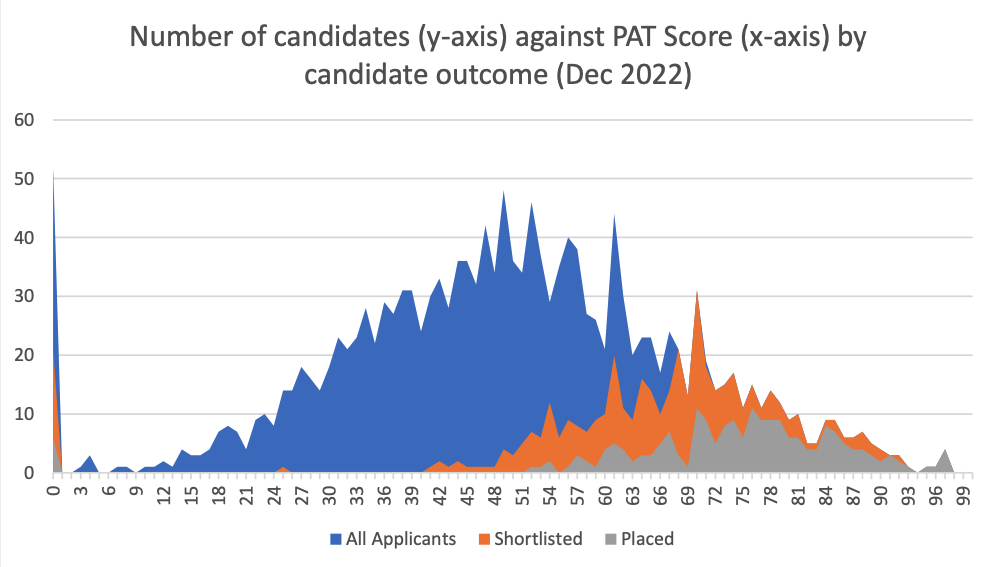
PAT Results 2022
PAT Results 2021
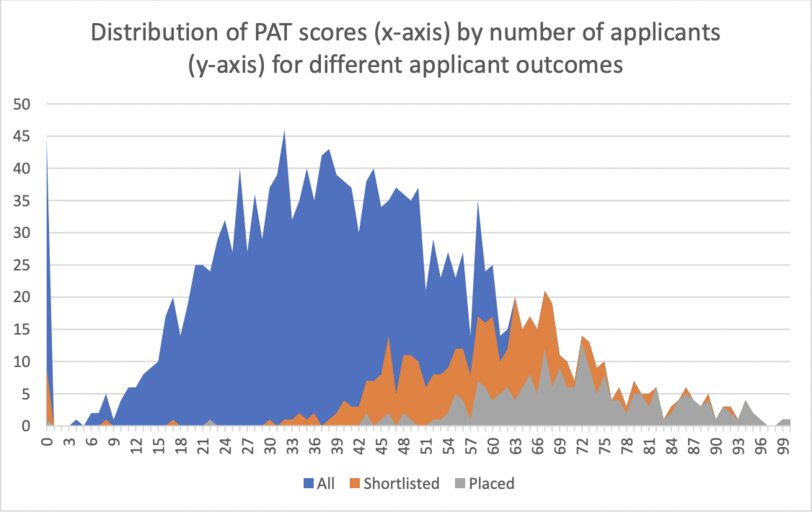
What can we see from these graphs? Let’s highlight the key trends seen across these four years.
Firstly, we can see that each year saw a high proportion of applicants score 0 points, usually 40 – 50 applicants. However, this also reflects applicants who did not take the test at all due to specific circumstances. Surprisingly, some of these applicants still earned their offers, meaning there is a small amount of flexibility in the admissions process.
Looking at the actual results, we can see a very wide spread of scores each year. In 2022 and 2023, the most common score achieved ranged from around 49 to 56. Meanwhile, this drops significantly in both 2021 and 2024, the latter of which having a modal score of around 37.
We can also see that, in most years, more applicants are given interviews as early as 20 marks, although it becomes much more common after 40 – 50 marks depending on the year. As for offers, the lowest-scoring offer holder in 2024 (excluding those with 0 marks) achieved a score of 34.
Average PAT Scores
Let’s now consider the averages seen within these results to learn more about how the cohort generally performed:
Average PAT Scores 2024
Average PAT Score: 49.6%
Standard Deviation for PAT Scores: 18.5%
Average PAT Scores 2023
Average PAT Score: 55.6%
Standard Deviation for PAT Scores: 18.6%
Average PAT Scores 2022
Average PAT Score: 51.2%
Standard Deviation for PAT Scores: 16%
Average PAT Scores 2021
Average PAT Score: 43.1%
Standard Deviation for PAT Scores: 17.7%
From the data we see here, we can see that the average score took a steep decline in 2024 of over 5%, while the standard deviation remained relatively unchanged. However, this is a surprising result, as the PAT underwent a major format change in 2024.
In short, the test was changed from a paper-based test to a fully computer-based one, which involved removing any longer written questions in favour of only using multiple-choice questions. In theory, this would make the test easier, as MCQs are generally easier questions to answer. However, the decline in the average score indicates that the test may have actually been harder this year.
If you are interested in taking a closer look at the examiners’ reports, you can find them here.
This information is a helpful way to know where you stand when doing past papers and to gain a better understanding of whether you actually did well or not. However, be aware that these scores won’t be fully reflective of the difficulty of the upcoming test, as there is always a level of inconsistency between papers.
Access "The Oxbridge Application Vault"
- 300+ page ebook for Oxbridge Applicants
- 25 page ebook for Personal Statement
- 2h+ online course to succeed in any exam
- Online Oxbridge Success Calculator
- 12 page ebook about UniAdmissions

Access "The Big Book Of Oxbridge Applications" For FREE
If you’re applying for Physics or Engineering at Oxford, then you’ll need to be prepared for not just the PAT but the other parts of the application process too. You can learn about everything you need to know about Oxbridge applications in The Big Book Of Oxbridge Applications, available for free here! Through over 350 pages, you will find:
- Over 40 admissions test practice questions
- 28 example Oxbridge Personal Statements
- Interviews with Oxbridge students and graduates
- Additional downloadable resources
Fill in your details below to claim your digital copy today!

what are good, average, and low PAT scores?
The distribution tables above provide an idea of what scores candidates have achieved, with a brief explanation of the tables themselves. But what actually is a good, average, or low score?
Based on what we have seen for the previous year’s results and the information provided by Oxford, we can see a pattern in regard to the scores. These can be categorised as follows:
What is a Good PAT Score?
It is generally agreed that anything from 70 and above is considered a good PAT score. A score of 80+ would be even better, but only the most exceptional applicant will achieve this. As you can see in the distribution charts above, around this mark is where there is a drop-off in the results, but remember that this is based on the old PAT format which was more difficult.
What is an Average PAT Score?
For the average PAT score, you would be looking at anything between 50 and 60.; the vast majority of applicants will find themselves in this category. The table above clearly demonstrates that applicants in this range will be shortlisted.
What is a Low PAT Score?
Anything below a 50, therefore, is considered a low PAT score. From the table above, we can that very few applicants find them shortlisted with a score of 40 or below, and subsequently very rarely placed.
Conclusion
Hopefully, from the above, you have a better understanding of how the scoring and results of the PAT works.
What is key to remember is that the conversion table and the distribution of results are not set in stone and will fluctuate each year due to the perceived difficulty of the Admissions Test.
The PAT is difficult, and it is designed to be that way, so do not feel disheartened if you feel you did not do your best as chances are everyone will have felt that way.
Maximise your PAT score through effective PAT preparation.
The PAT is a vital component of your Oxford application so scoring highly can mean the difference between an offer or rejection. At UniAdmissions, we are experts at boosting your PAT score and maximising your chances of gaining a place.
Discover our PAT support by clicking the button below to enrol and triple your chances of success.